Posts Tagged ‘Tania Hosmer


10
Oct
11

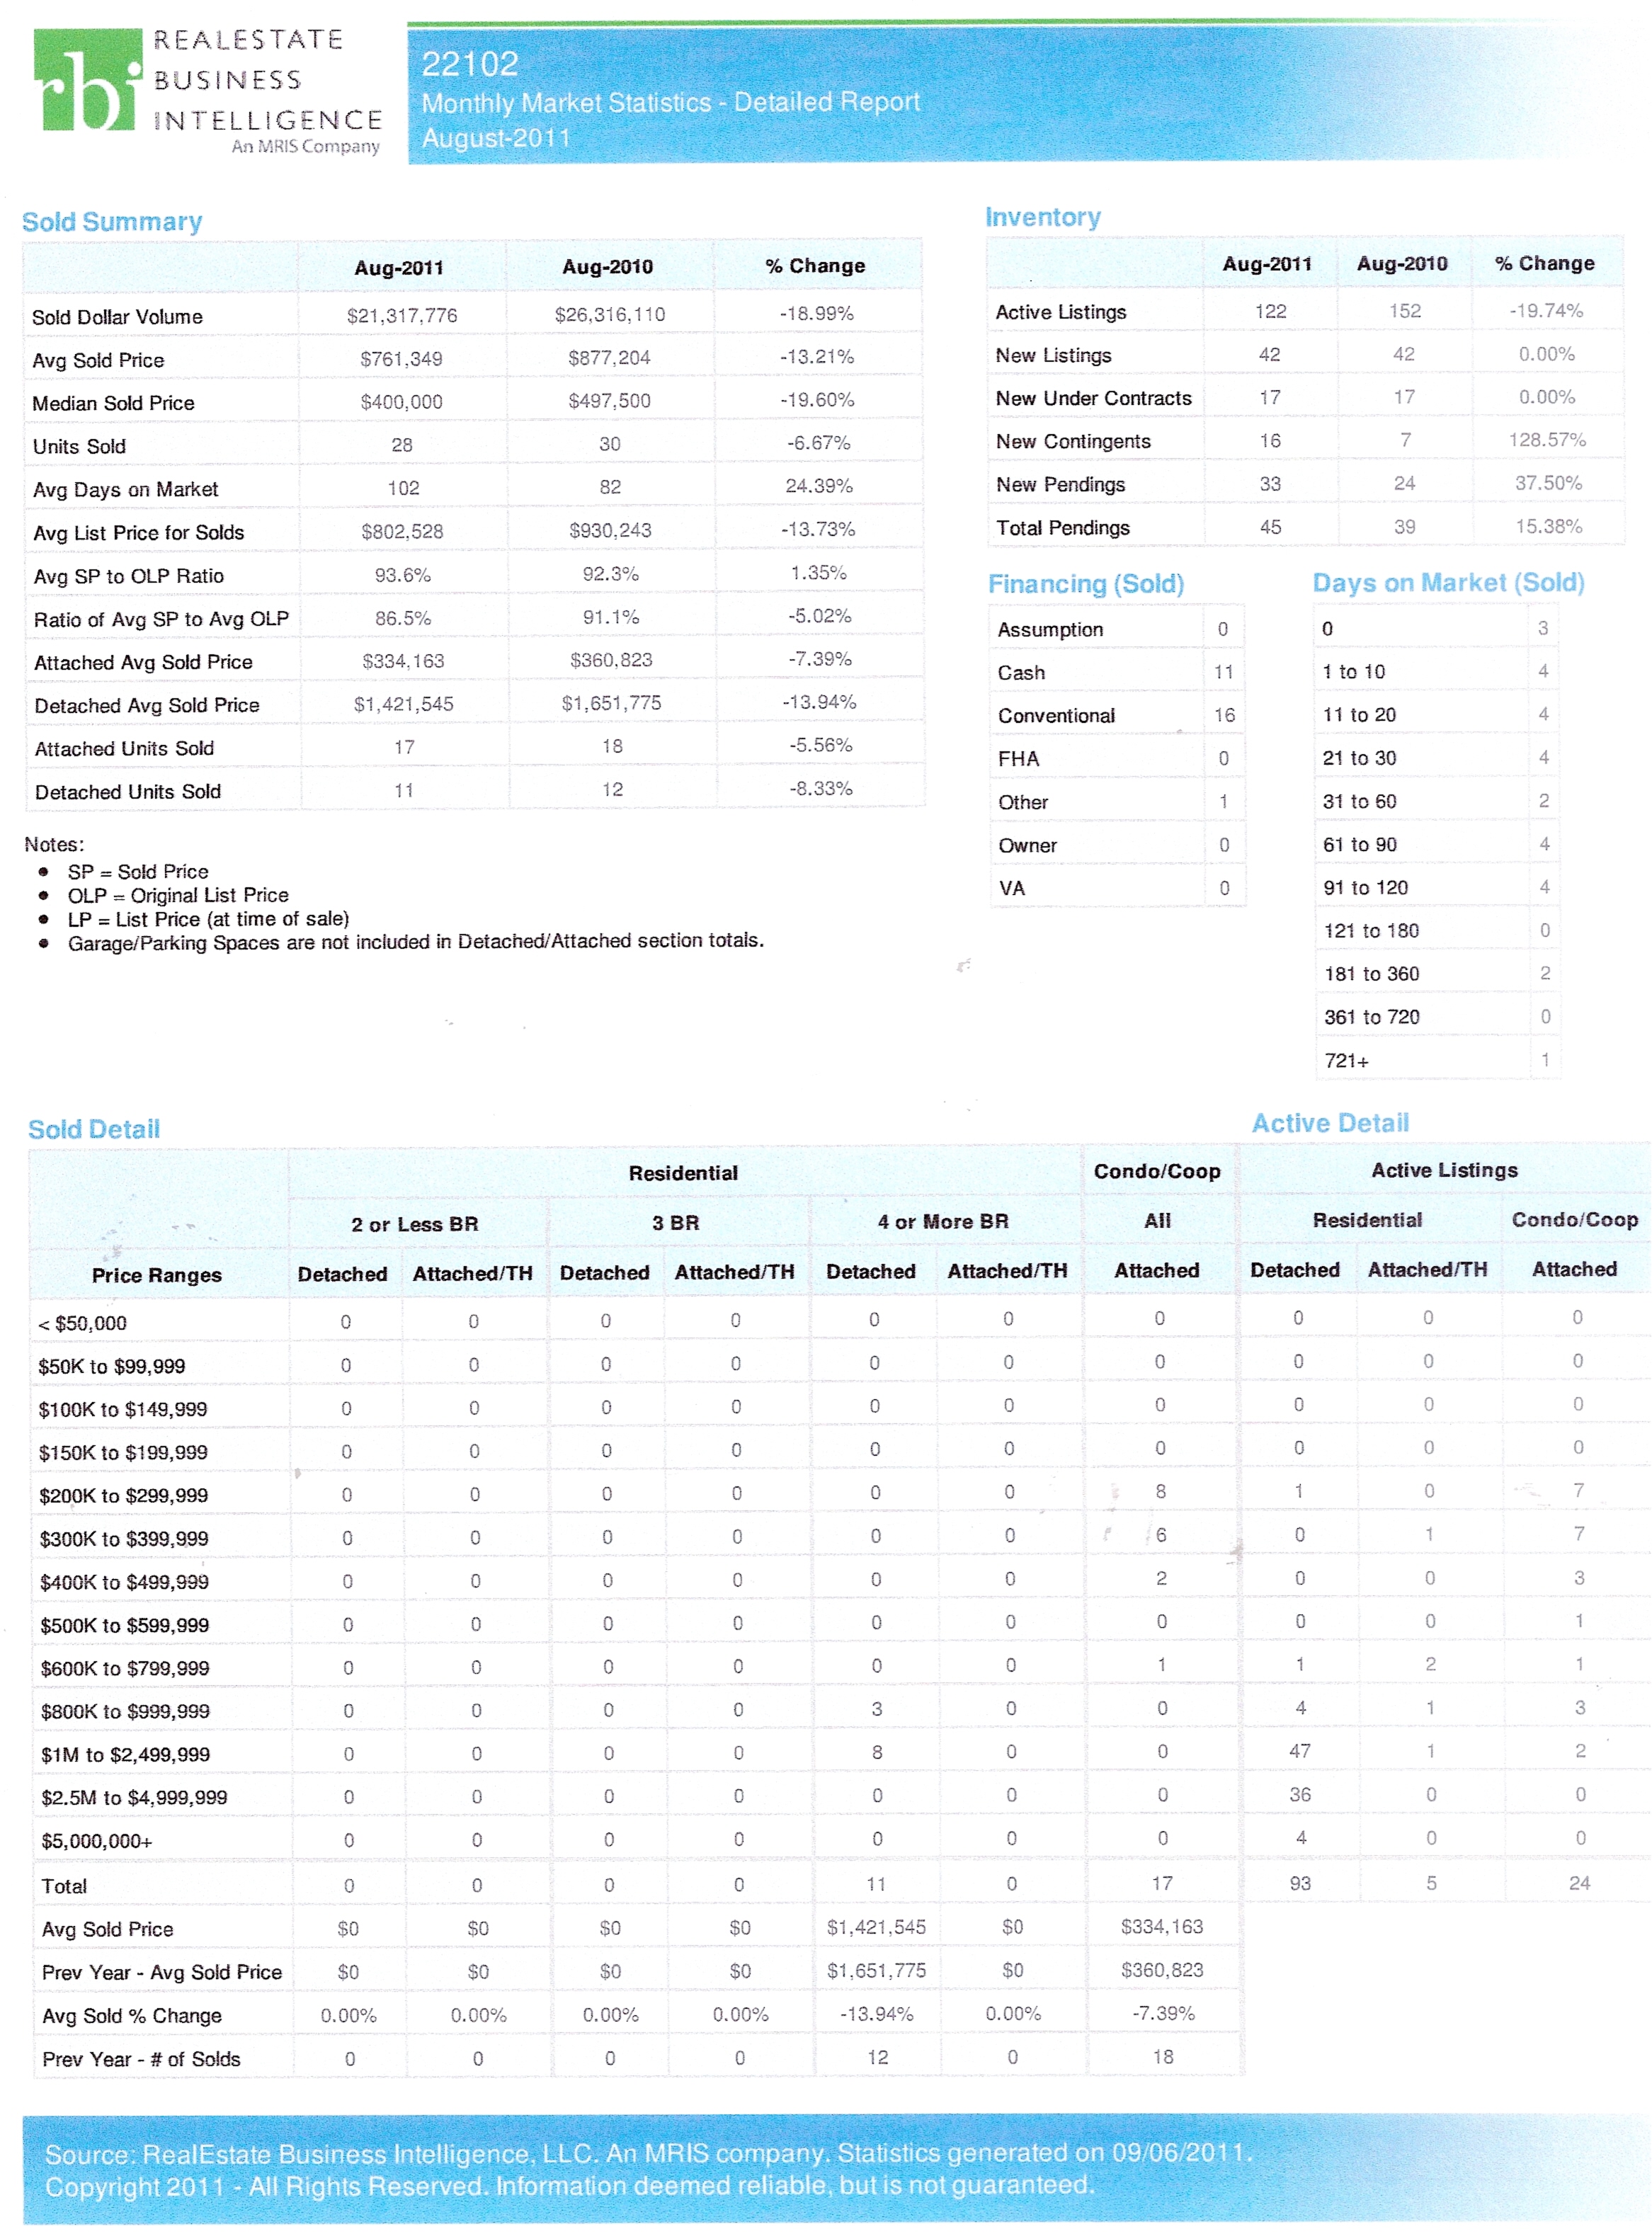
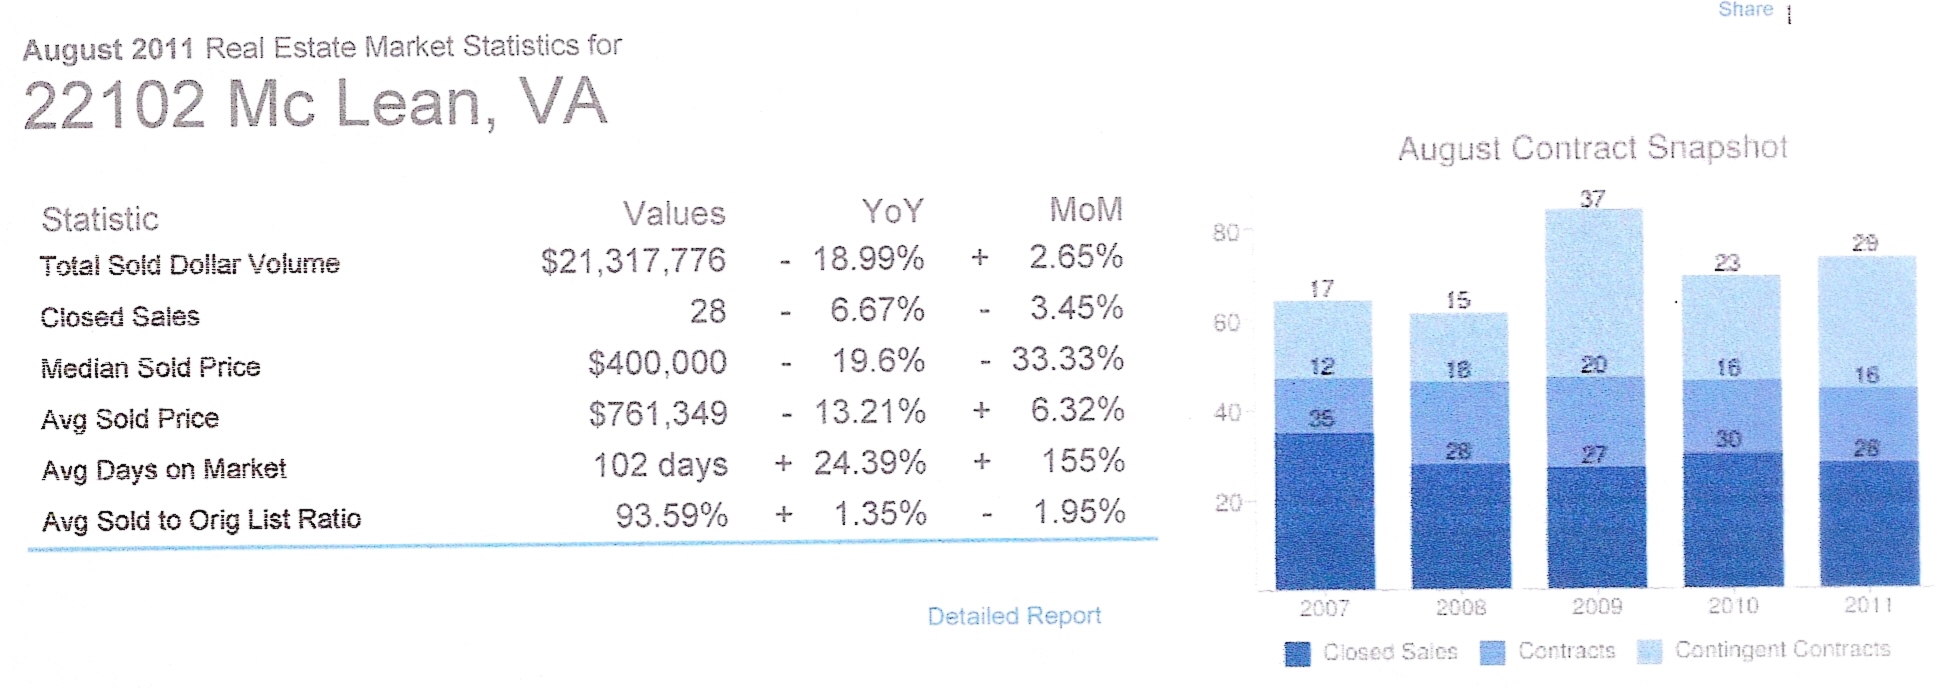
Market Statistics – McLean VA 22102 – August 2011

Click to enlarge the below images for printing or a better view.

If you have any questions about these statistics or would like to discuss them or current real estate market conditions, I follow the market trends very closely and would be happy to discuss them with you.  I can be reached by email at taniahosmer@gmail.com or phone at 703-403-8225.

21
Sep
11

State of the Real Estate Market of McLean, VA 22102 – Quarter End 6/30/11

There is a popular saying among top economists:  “As goes housing, so goes the economy.”

Normally, nationwide housing and housing-related services account for about 15-19% of the Gross Domestic Product (GDP), depending on the year.  However, broad generalizations like, “It’s a great time to buy,” don’t even begin to tell the whole story, particularly here in Northern Virginia.  In order to fully understand our local housing market, the statistics need to be broken down into meaningful parts which can be understood and applied by the average home owner and potential buyer.

This analysis provides a snapshot in time of our constantly changing local real estate market.  Hopefully, it will provide you with a more detailed and accurate picture of what is happening in our market today.

State of the Real Estate Market in McLean, VA 22102 for the Quarter End 6/30/11

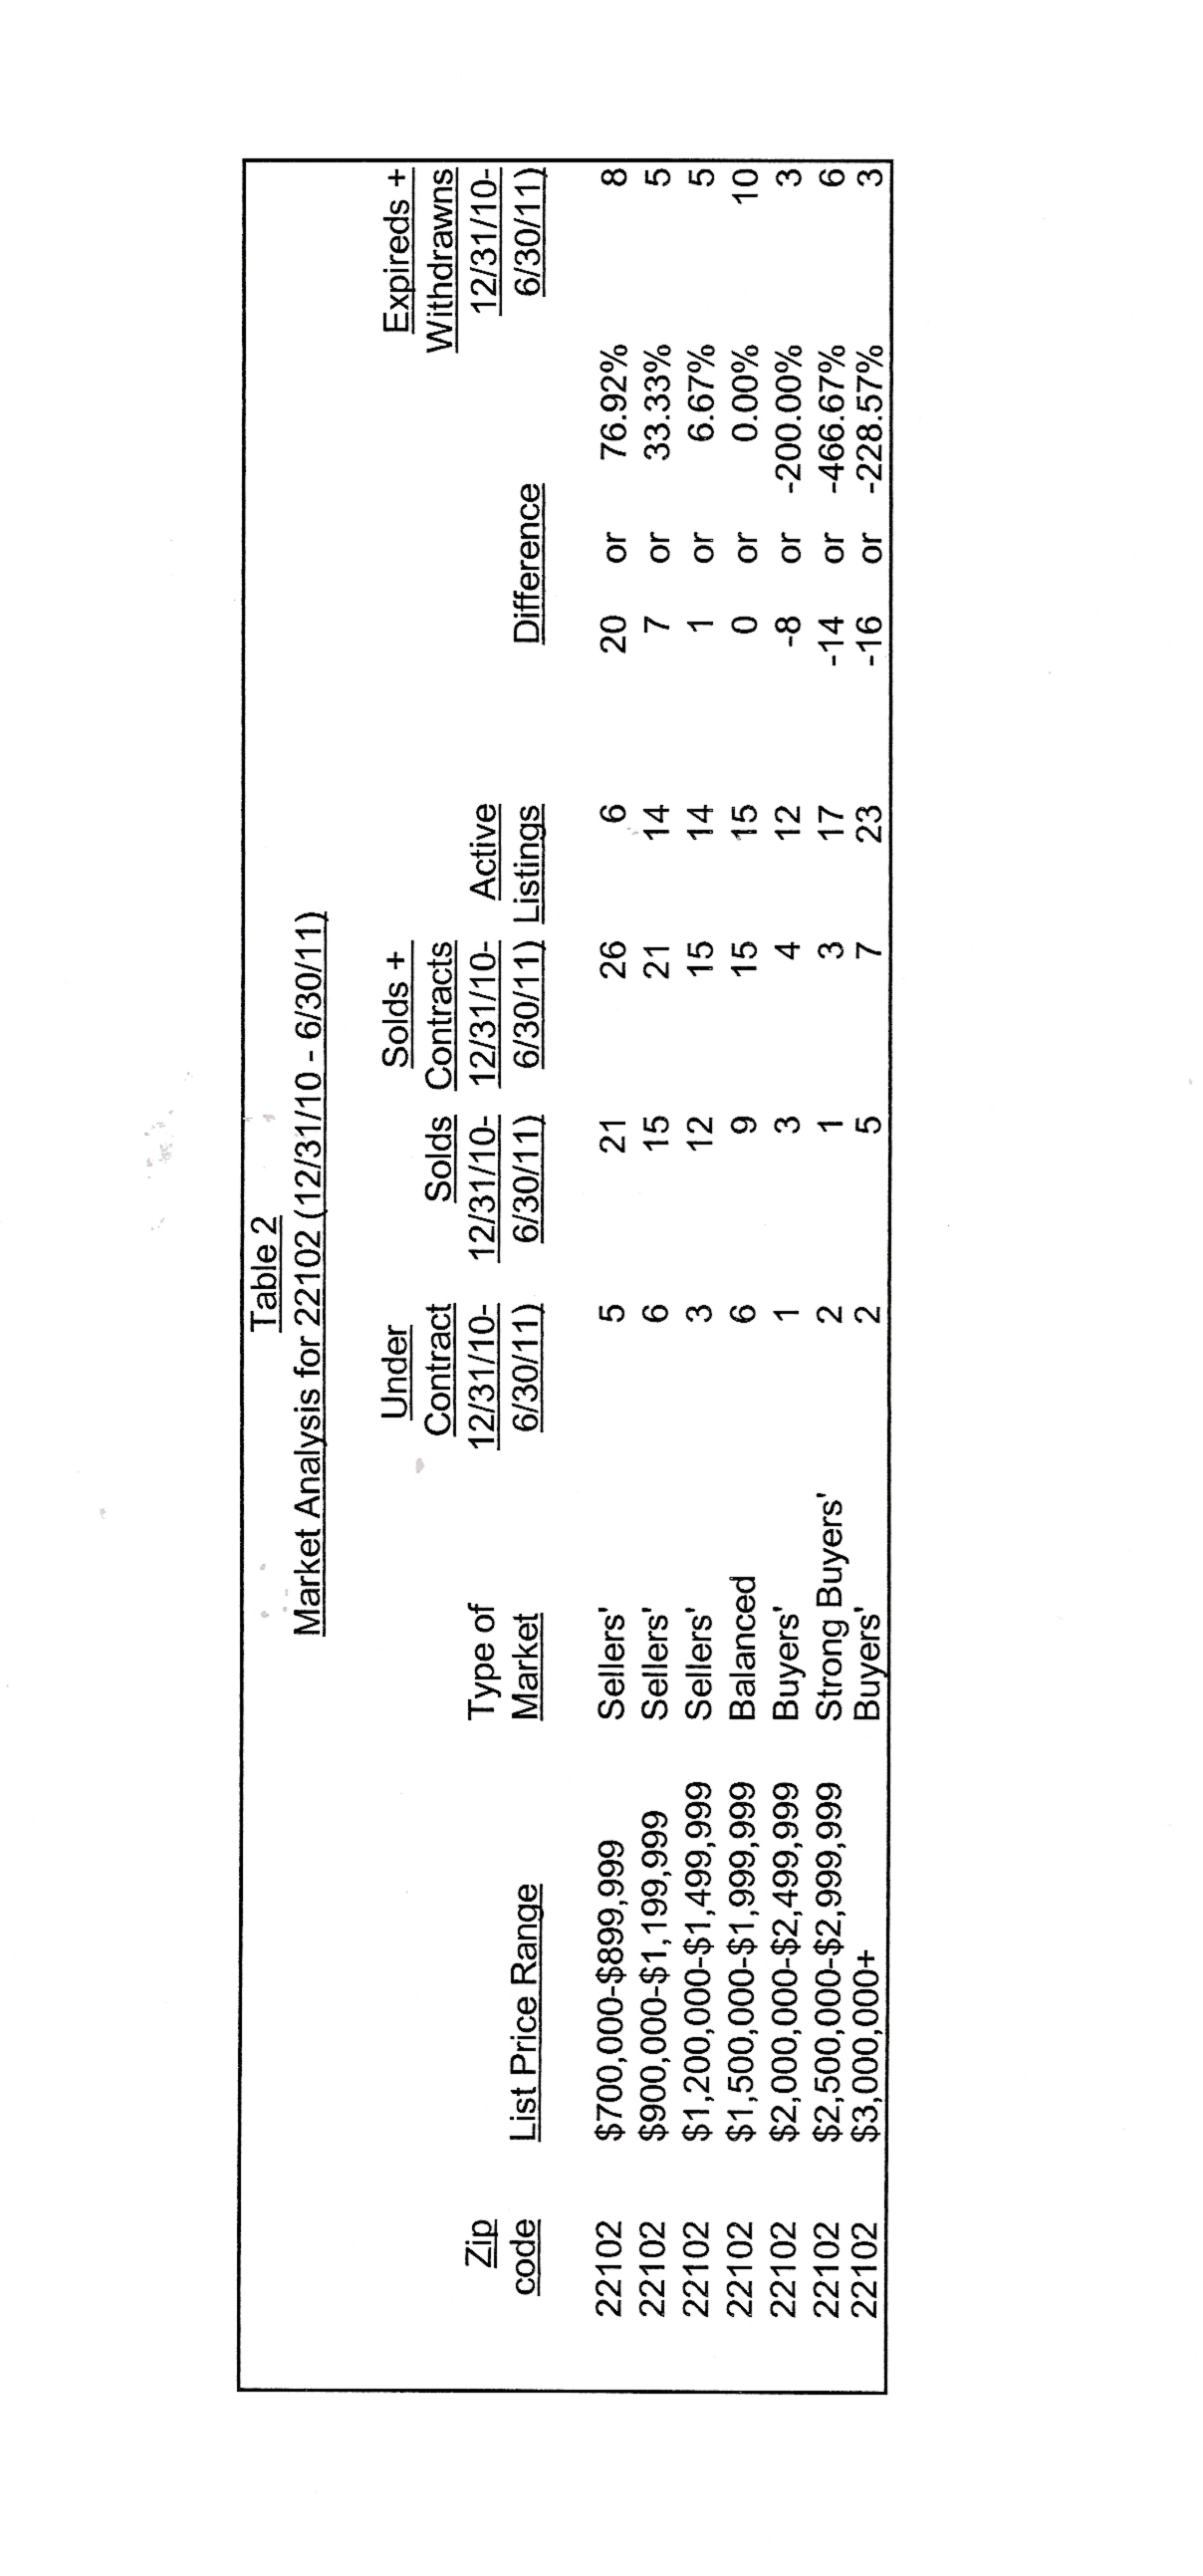
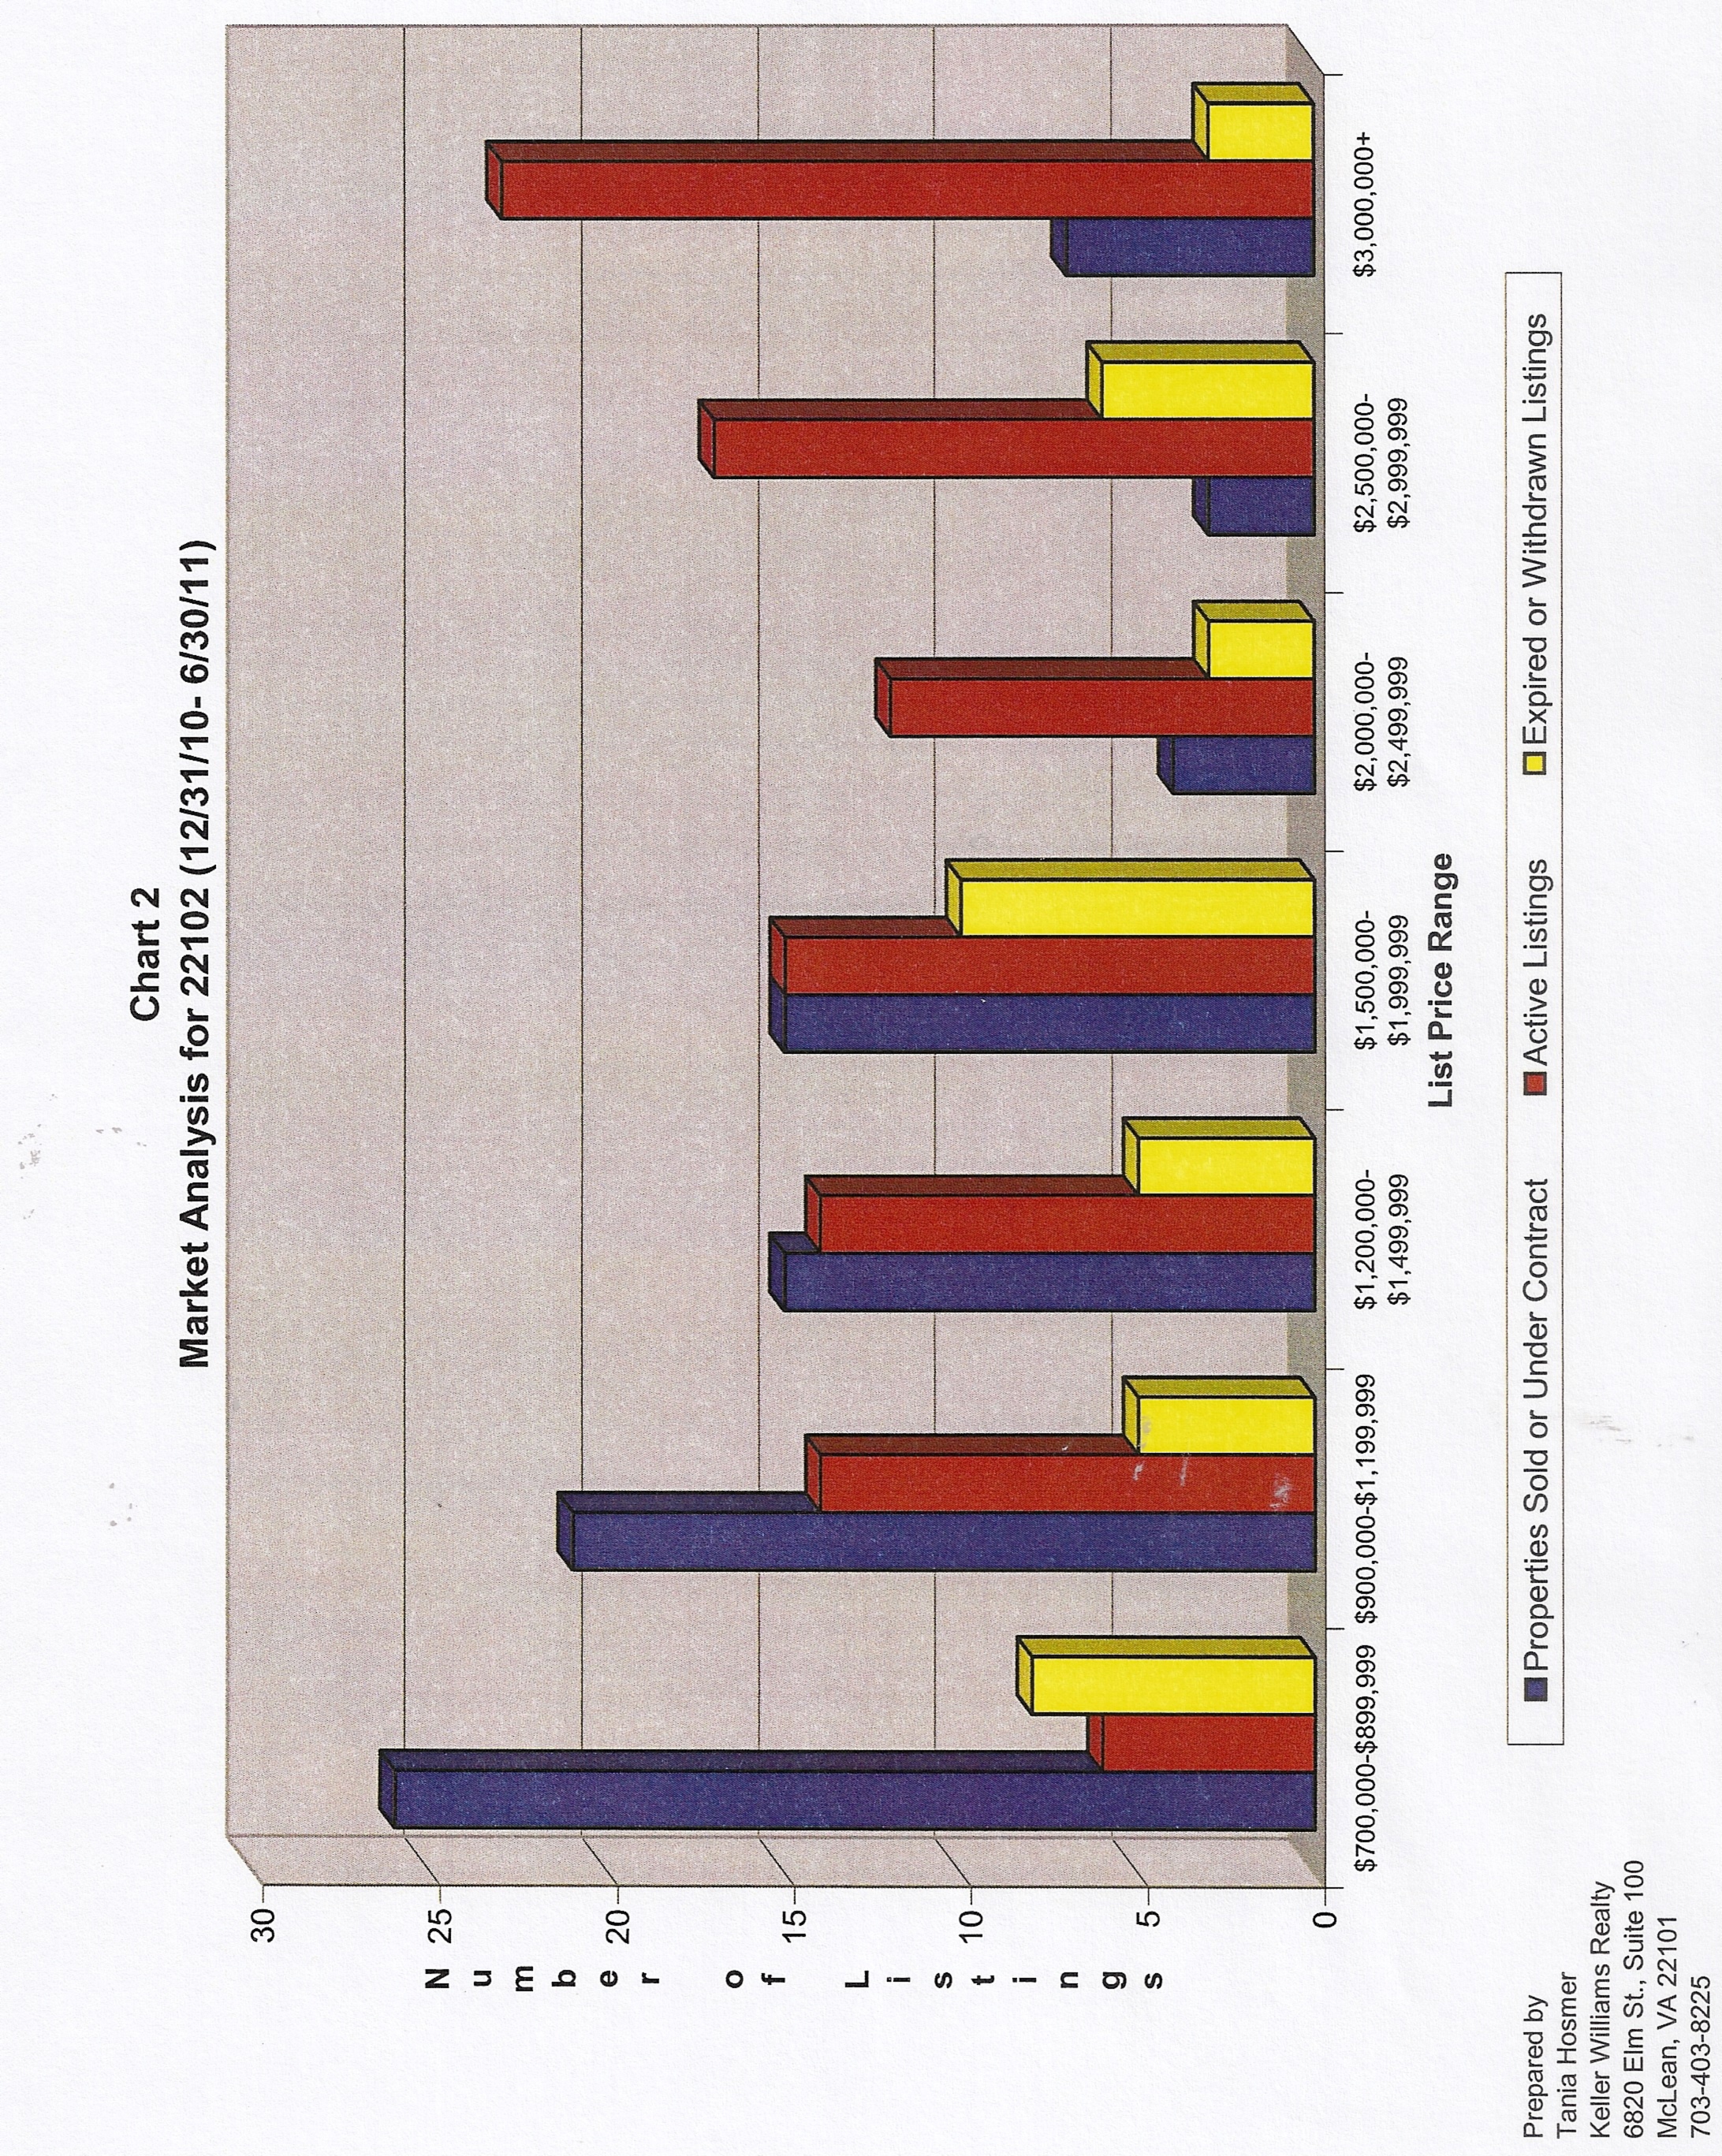
The following table and chart compare the number of active listings (the supply) to the number of properties sold or under contract (the demand) in the local real estate market of McLean 22102 by price range for the period from 12/31/10 – 6/30/11.

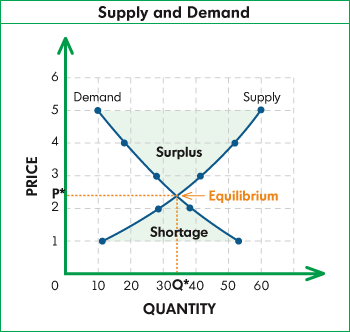
Based on the balance, the real estate market in our area can be characterized in one of three ways:

Buyers’ Market – More properties for sale (Supply) than properties that have sold in the past 6 months or are currently under contract (Demand)

Balanced Market – an equal number of properties for sale (Supply) as properties that have sold in the past 6 months or are currently under contract (Demand)

Sellers’ Market – more properties that sold in the past 6 months or are currently under contract (Demand) than properties that are currently for sale (Supply)

To get an enlarged view of the table or chart, click on them.

22102 Summary

  • $700,000 – $899,999 – Sellers’ Market. There are over 4 times the number of sold plus under contract listings as the number of active listings.
  • $900,000 – $1,199,999 – Sellers’ Market. If you factor in the withdrawn and expired listings, this range is closer to balanced.
  • $1,200,000 – $1,499,999 – Sellers’ Market, but very close to a balanced market (without factoring in the withdrawn and expired listings). 
  • $1,500,000 – $1,999,999 – Balanced Market.  There is an equal number of active listings as sold and under contract listings combined.  If you factor in the number of withdrawn and expired listings, this range would become a sellers’ market.
  • $2,000,000 – $2,499,999 – Buyers’ Market.  There are 3 times the number of active listings as sold and under contract listings combined.
  • $2,500,000 – $2,999,999 – Strong Buyers’ Market.  There are more than 5 times the number of active listings as sold and under contract listings combined.
  • $3,000,000 and up – Buyers’ Market.  There are more than 3 times the number of active listings as sold and under contract listings combined.

If you have any questions about the McLean-Great Falls real estate market, please don’t hesitate to contact me at taniahosmer@gmail.com.

25
Jun
11

Recently Listed in McLean, VA 22101 – Past 2 Week – June 9, 2011 – June 23, 2011

Recently Listed in McLean, VA 22101 – Past 2 Weeks

Twenty-three (23) properties were listed for sale in the past 2 weeks (June 9, 2011 – June 23, 2011) in the postal code area of 22101 of McLean, VA  with six (6) already under contract.

Ten (10) are listed for under $1,000,000.  Seven (7) are listed between $1,000,000 and $2,000,000.  Three (3) are listed between $2,000,000 and $2,500,000.  Two (2) are listed between $3,000,000 and $4,000,000. One (1) is listed for over $5,000,000.

Status ML# Address List Price Subdivision DOM
CONTRACT FX7632293 1804 BIRCH RD $570,000 EL NIDO ESTATES 0
ACTIVE FX7623465 6626 MCLEAN CT $625,000 OLD DOMINION SQUARE 14
ACTIVE FX7628794 1410 DOLLEY MADISON $629,000 BEVERLY MANOR 8
CNTG/NO KO FX7628398 1647 WRIGHTSON DR $687,800 WEST GRASS RIDGE 4
ACTIVE FX7628738 1521 EMERSON AVE $699,900 BRYN MAWR CLUSTER 8
ACTIVE FX7624509 7021 ENTERPRISE AVE $700,000 BROYHILLS MCLEAN ESTS 13
CNTG/NO KO FX7625045 1714 BALDWIN DR $740,000 W LEWINSVILLE HEIGHTS 13
CONTRACT FX7627469 3959 DUMBARTON ST $829,000 COUNTRY ACRES 5
ACTIVE FX7624414 7201 EVANS MILL RD $899,000 EVANS MILL POND 14
ACTIVE FX7623482 1701 CRESCENT LN $989,000 CLAUDE H SMITH PROP 14
ACTIVE FX7627363 1420 JULIA AVE $1,149,900 SALONA VILLAGE 9
ACTIVE FX7634188 2013A LORRAINE AVE $1,198,750 FRANKLIN PARK 0
CNTG/NO KO FX7626154 6505 ANNA MARIA CT $1,249,000 LANGLEY OAKS 11
CNTG/NO KO FX7624350 2007 FRANKLIN AVE $1,325,000 FRANKLIN FOREST 5
ACTIVE FX7631762 1841 WESTMORELAND ST $1,458,000 KENT GARDENS 3
ACTIVE FX7626957 6053 RAMSHORN PL $1,899,000 LANGLEY 10
ACTIVE FX7634161 6517 BRAWNER ST $1,950,000 SALONA VILLAGE 1
ACTIVE FX7633036 898 HELGA PL $2,055,000 BEAUFORT PARK 2
ACTIVE FX7628694 1945 ROCKINGHAM ST $2,295,000 FRANKLIN PARK 8
ACTIVE FX7628734 2023 ROCKINGHAM ST $2,495,000 FRANKLIN PARK 8
ACTIVE FX7627324 1100 WAVERLY WAY $3,275,000 LANGLEY FARMS 9
ACTIVE FX7626344 6901 BENJAMIN ST $3,775,000 LANGLEY FOREST 10
ACTIVE FX7625481 825 CLINTON PL $5,600,000 LANGLEY FOREST 11

Below is a link to the complete MRIS listings for these properties which include more details like lot size, number of bedrooms and bathrooms, tax assessment and photographs.

http://mrislistings.mris.com/Matrix/Public/Portal.aspx?k=1582934X2DOF&p=DE-143161434-437

If you have any questions about the information contained in my blog, please feel free to contact me at taniahosmer@gmail.com.

24
Jun
11

Recently Sold in McLean, VA 22101 – Past 10 Days – June 13, 2011 – June 23, 2011

Recently Sold in McLean, VA 22101 – Past 10 Days

Eighteen (18) properties sold in the past 10 days (June 13, 2011 – June 23, 2011) in the postal code area of 22101 of McLean, VA.  Three (3) sold for under $500,000. Five (5) sold for between $500,000 and $750,000. Six (6) sold for between $750,000 and $975,000. Four (4) sold between $1,000,000 and $1,700,000.

ML# Address Subdivision DOM Close Price Subsidy
FX7570432 6800 FLEETWOOD RD #511 MC LEAN HOUSE NORTH 37 $315,000 $0
FX7596376 1951 KIRBY RD WESTMORELAND PLACE 17 $485,000 $0
FX7596698 1841 WESTMORELAND ST KENT GARDENS 1 $475,000 $0
FX7564697 6901 BLUE STAR DR DEVON PARK 35 $548,000 $0
FX7552728 6228 COTTONWOOD ST CHESTERBROOK 53 $600,000 $0
FX7594907 1712 MARGIE DR W. LEWINSVILLE HEIGHTS 11 $675,000 $2,500
FX7582904 1457 HAMPTON HILL CIR HAMPTONS OF MC LEAN 25 $709,000 $0
FX7583428 7407 CHURCHILL RD WEST LANGLEY 19 $749,900 $9,000
FX7489517 6200 CHESTERBROOK RD CHESTERBROOK WOODS 401 $785,000 $0
FX7582125 1869 KIRBY RD CHESTERBROOK 17 $780,000 $0
FX7576204 6856 CHELSEA RD BEVERLY MANOR 43 $857,500 $14,000
FX7551271 6109 RAMSHORN PL CLEARVIEW MANOR 104 $900,000 $4,000
FX7552938 1516 EMERSON AVE TALAH 2 $960,000 $1,200
FX7589839 711 RIDGE DR LANGLEY OAKS 1 $1,000,000 $0
FX7043082 6703 LUPINE LN PARKVIEW HILLS 371 $850,000 $0
FX7588616 1013 BROAD BRANCH CT TREELINE 3 $1,170,000 $0
FX7579114 1886 VIRGINIA AVE FRANKLIN PARK 18 $1,450,000 $0
FX7599415 1230 PROVIDENCE PROVIDENCE FOREST 15 $1,655,000 $0

Below is a link to the complete MRIS listings for these properties which include more details like lot size, number of bedrooms and bathrooms, tax assessment and photographs.

http://mrislistings.mris.com/Matrix/Public/Portal.aspx?k=1582934X2DOF&p=DE-143145309-121

If you have any questions about the information contained in this post or the local McLean-Great Falls real estate market, please feel free to contact me at taniahosmer@gmail.com or 703-403-8225.

21
Jun
11

McLean, VA 22102 Housing Market – Comparative Analysis – Quarter End 3/31/10 vs. Quarter End 3/31/11

There is a popular saying among top economists:  “As goes housing, so goes the economy.”

Normally, nationwide housing and housing-related services account for about 15-19% of the Gross Domestic Product (GDP), depending on the year.  However, broad generalizations like, “It’s a great time to buy,” don’t even begin to tell the whole story, particularly here in Northern Virginia.  To further understand our local housing market, the statistics need to be compared from quarter to quarter or year to year, so that the average home owner and potential buyer can see the trends in the local housing market.

Hopefully, this analysis will provide you with a more detailed and accurate picture of what is happening in our local housing market.

Housing Market Comparative Analysis for McLean, VA 22102

Quarter End 3/31/10 vs. Quarter End 3/31/11

I compared my market analyses for McLean, VA 22102 for the quarters ending 3/31/10 and 3/31/11 and compiled the data first into a table, then charted the data.  The table and chart are below.  For a larger view of either the table or chart, click on them.

Summary of 22102 Comparison

  • $700,000 – $1,199,999 – between the first quarter of 2010 and the first quarter of 2011, this range stayed relatively stable as a sellers’ market.
  • $1,200,000 – $1,499,999 – between the first quarter of 2010 and the first quarter of 2011, this range stayed relatively stable as a balanced market.
  • $1,500,000 – $1,999,999 – between the first quarter of 2010 and the first quarter of 2011, this range stayed relatively stable as a buyers’ market.
  • $2,000,000-$2,499,999 – between the first quarter of 2010 and the first quarter of 2011, this range became a weaker buyers’ market, or better for sellers.
  • $2,500,000 – $2,999,999 – between the first quarter of 2010 and the first quarter of 2011, this range stayed relatively stable as a strong buyers’ market.
  • $3,000,000+ – between the first quarter of 2010 and the first quarter of 2011, this range became a weaker buyers’ market, or better for sellers’.

Please refer to my previous post for the quarter end 3/31/10:

http://mcleanrealestate.wordpress.com/2010/06/08/first-quarter-2010-market-analysis-for-mclean-great-falls/

If you have any questions about this post or about the McLean-Great Falls real estate market, please don’t hesitate to contact me at taniahosmer@gmail.com.

20
Jun
11

State of the Real Estate Market – McLean, VA 22102 – Quarter End 3/31/11

There is a popular saying among top economists:  “As goes housing, so goes the economy.”

Normally, nationwide housing and housing-related services account for about 15-19% of the Gross Domestic Product (GDP), depending on the year.  However, broad generalizations like, “It’s a great time to buy,” don’t even begin to tell the whole story, particularly here in Northern Virginia.  In order to fully understand our local housing market, the statistics need to be broken down into meaningful parts which can be understood and applied by the average home owner and potential buyer.

This analysis provides a snapshot in time of our constantly changing local real estate market.  Hopefully, it will provide you with a more detailed and accurate picture of what is happening in our market today.

State of the Real Estate Market in McLean, VA 22102 for the Quarter End 3/31/11

The following table and chart compare the number of active listings (the supply) to the number of properties sold or under contract (the demand) in the local real estate market of McLean 22102 by price range for the period from 9/30/10 – 3/31/11.

Based on the balance, the real estate market in our area can be characterized in one of three ways:

Buyers’ Market – More properties for sale (Supply) than properties that have sold in the past 6 months or are currently under contract (Demand)

Balanced Market – an equal number of properties for sale (Supply) as properties that have sold in the past 6 months or are currently under contract (Demand)

Sellers’ Market – more properties that sold in the past 6 months or are currently under contract (Demand) than properties that are currently for sale (Supply)

To get an enlarged view of the table or chart, click on them.

22102 Summary

  • $700,000 – $1,199,999 – Sellers’ Market.  If you factor in the withdrawn and expired listings, this range is closer to balanced.
  • $1,200,000 – $1,499,999 – Balanced Market (without factoring in the withdrawn and expired listings)
  • $1,200,000 – $1,499,999 – The amount of withdrawn and expired listings would increase the number of active listings by 80%, if they came back on the market, and shift the market from balanced to a buyers’ market.
  • $1,500,000 – $1,999,999 – Buyers’ Market (without factoring in the withdrawn and expired listings).  There are almost 2 times the number of active listings as sold and under contract listings combined.
  • $1,500,000 – $1,999,999 – If you factor in the withdrawn and expired listings, the number of active listings would be almost 3 times the number of sold plus under contract listings.
  • $2,000,000 – $2,499,999 – Buyers’ Market.  The 1 withdrawn listing is negligibly significant.
  • $2,500,000 – $2,999,999 – Strong Buyers’ Market
  • $2,500,000 – $2,999,999 – There are 6 times the number of active listings as sold and under contract listings.
  • $3,000,000 and up – Buyers’ Market
  • $3,000,000 and up – There are over twice the number of active listings as sold and under contract listings.

If you have any questions about the McLean-Great Falls real estate market, please don’t hesitate to contact me at taniahosmer@gmail.com.

12
Jun
11

McLean, VA 22101 – Multiple Listing Service Statistics – May 2011

McLean, VA 22101 – Multiple Listing Service Statistics – May 2011

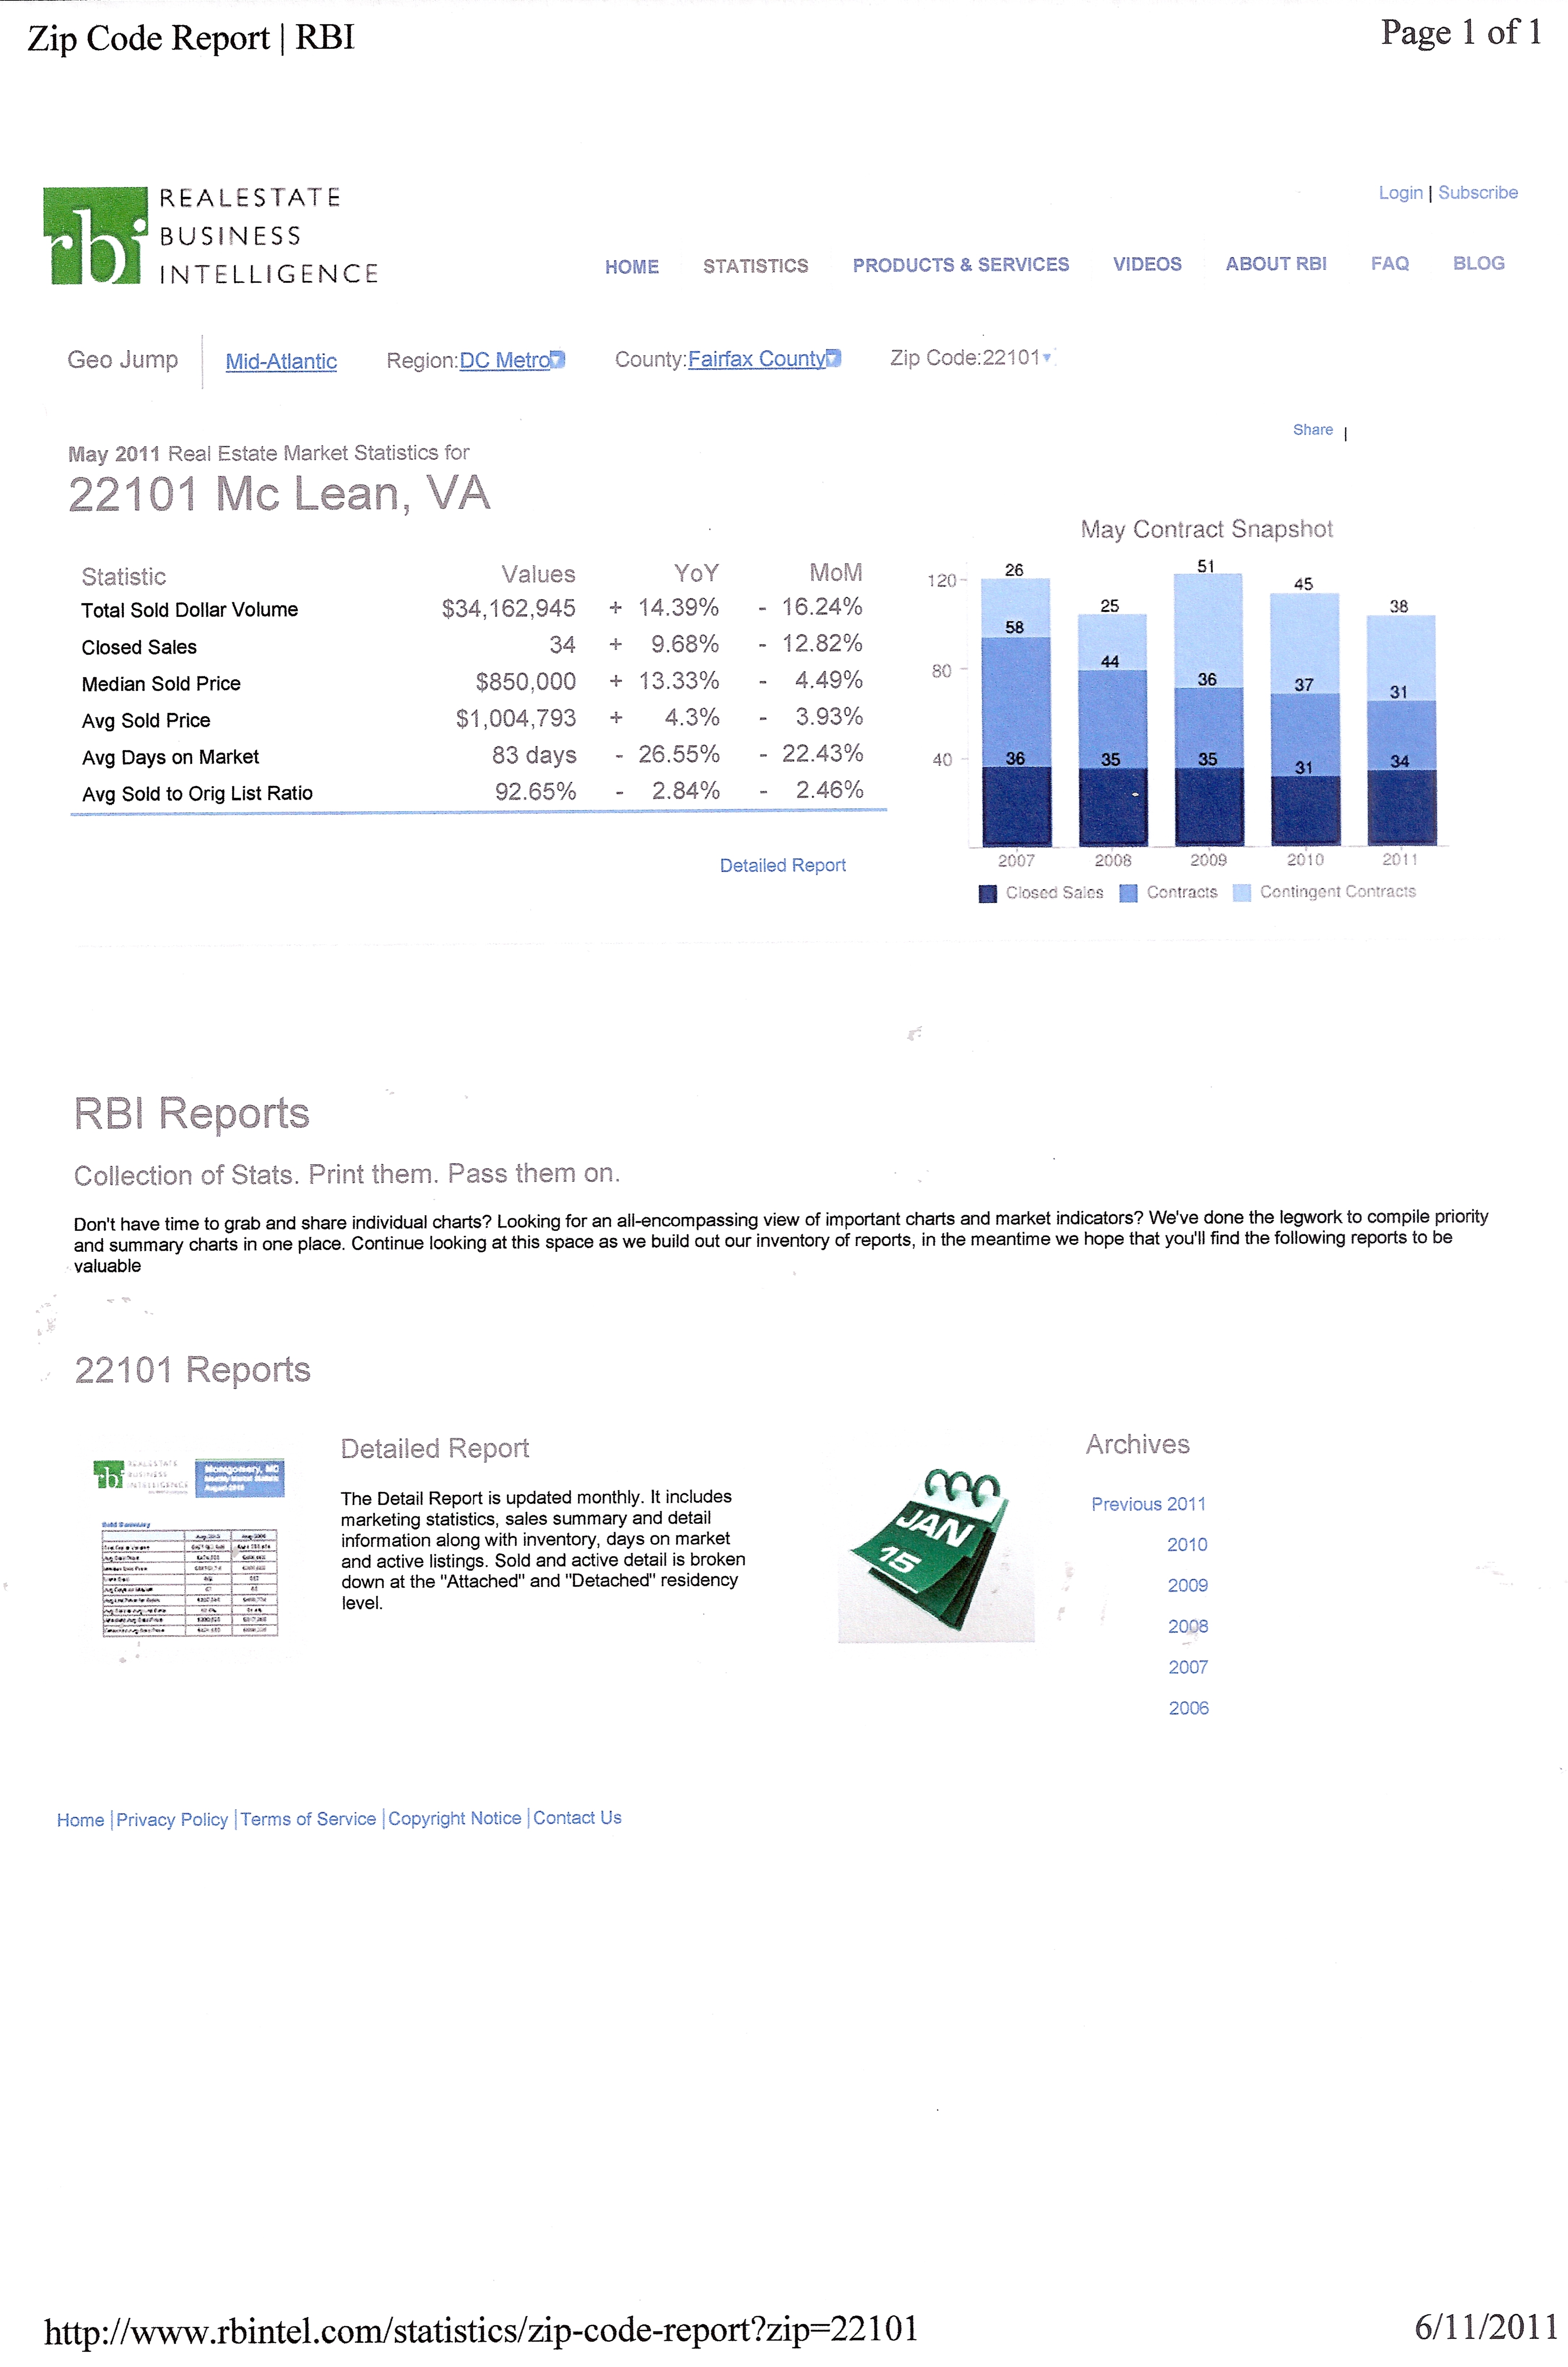
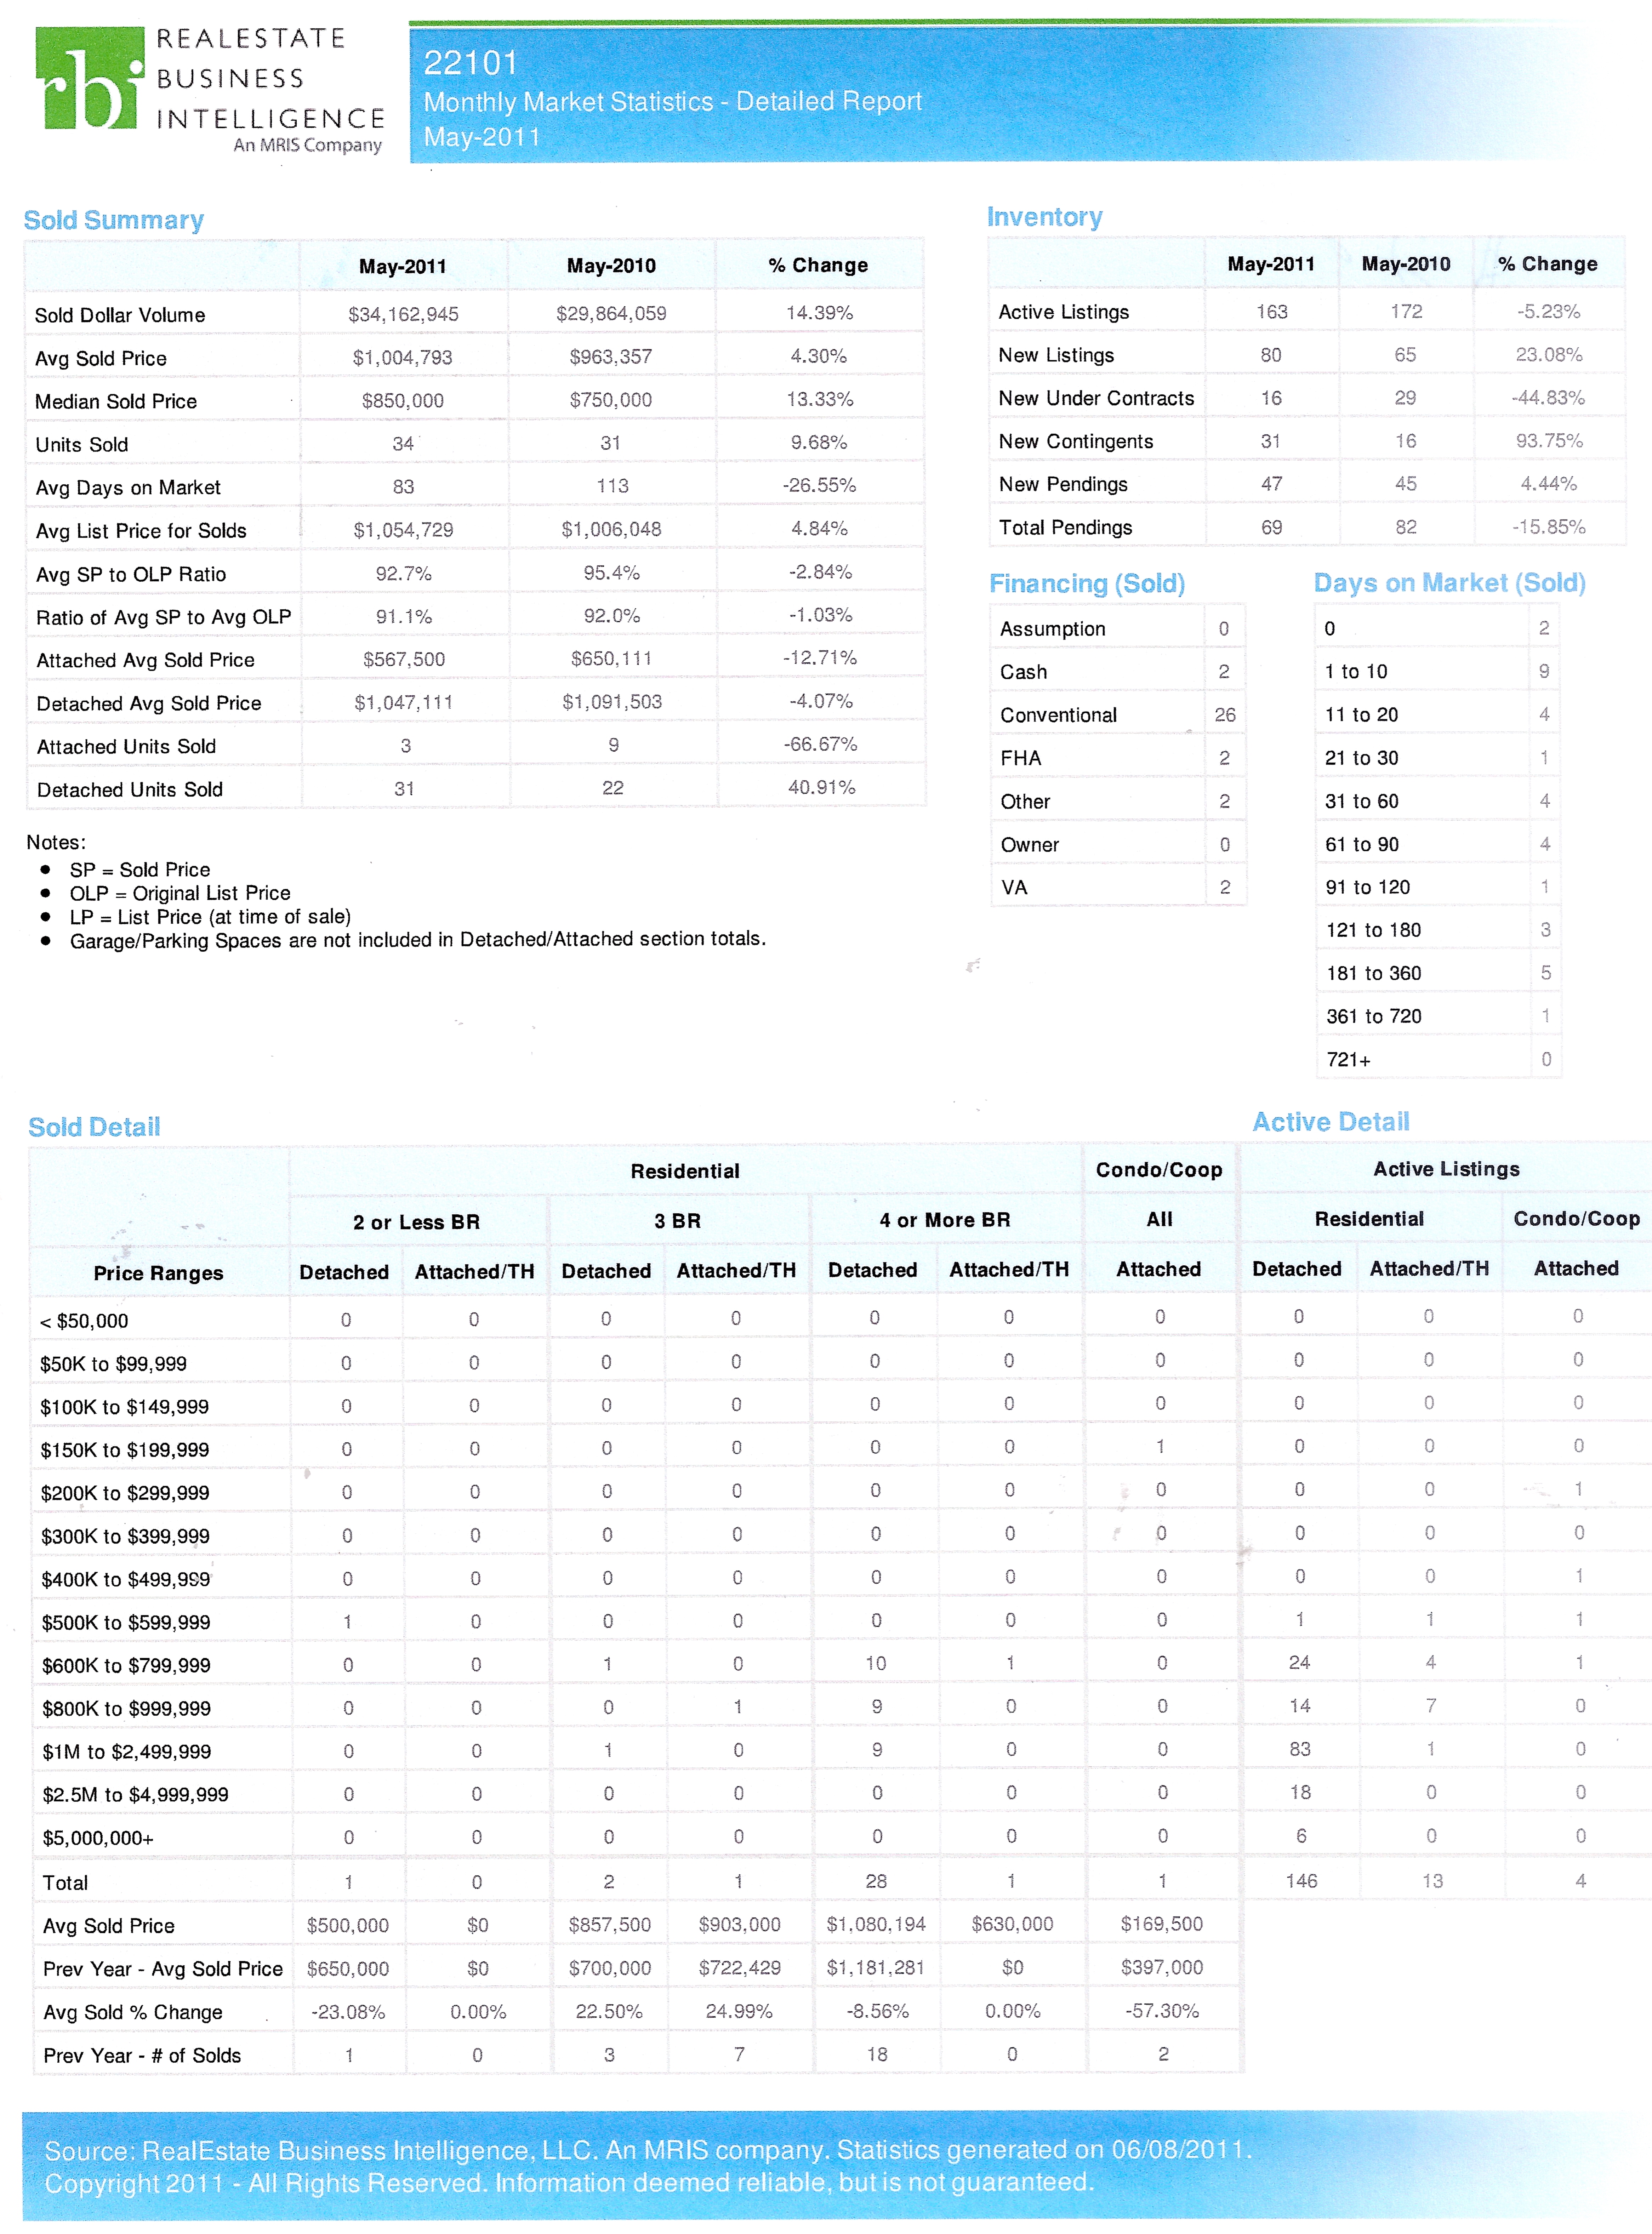
Here are 2 jpeg files containing the latest market statistics for McLean VA 22101 from the local multiple listing service (click on files to see larger views):

Here are links to pdf files of the statistics (which are easier to read):

22101 May 2011 Stats

22101 May 2011 Stats 2

The statistics show the following changes from May 2010 to May 2011:

  • a decrease in number of total contracts form 82 to 69 (broken down as follows):
    • non-contingent contracts from 37  to 31
    • a decrease in number of contingent contracts from 45 to 38
  • a 14.39% increase in dollar volume for the month
  • a 4.3% increase in average sold price
  • a 9.68% increase in units sold from 31 to 34
  • a small decrease in average sales price to original list price ratio of 2.84%
  • a 66.67% decrease in number of attached units sold
  • a 40.91% increase in number of detached units sold from 22 to 31
  • a decrease in the number of days on the market of 26.55%

34 properties sold in McLean VA 22101 in May of 2011.  As of May 31, 2011, 163 properties were on the market and 69 properties were under contract.

As compared to May 2010, the number of active listings was down by 5.23% and the number of contracts was down 15.85%, but the number of properties sold was up by 9.68%.

If you have any questions about this post or the McLean-Great Falls real estate market, please don’t hesitate to contact me at taniahosmer@gmail.com,

09
Jun
11

Can You “Time the Market”?

Can You Time the Market?
Historical Contract Data in the Reserve in McLean, VA 22102
Is it possible to time the market?
Recently a neighbor asked, have we missed the opportunity to list our property and get a contract/sell it this year?  I based my answer on some generalizations and what we typically see in the real estate industry.  Generally, we see more properties come on the market in the Spring and a peak in sales and closings in June and July of each year.   However, there are 2 schools of thought.  If you list a property in an “off”season like the Fall or Winter, there will be less inventory and thus less competition for properties on the market.
Many families with children prefer to buy in the summer, so they can move and settle in before the beginning of the school year.  But, there are people who have to buy in the “off” months because of necessity or perceive more value in properties  on the market in the “off” seasons (i.e. that property prices are lower).
So can you really time the market?  What you need to do is price your home properly for current market conditions.  This means that you need to consider the following:
(1) recent sales of comparable properties,
(2) sold prices of recently sold comparable properties,
(3) how long they were on the market and any price changes,
(4) comparable properties currently under contract, their list prices, any price adjustments, and how long they were on the market,
(5) comparable properties currently on the market, their list prices, any price adjustments, and how long they have been on the market,
(6) comparable properties that were taken off the market, their list prices, any price adjustments, and how long they were on the market,
(7) how many comparable properties sold in the past 6 months,
(8) how many comparable properties are currently under contract, and
(9) how many comparable properties are currently on the market.
The last 3 numbered items will tell you about the balance of the market – whether it is a buyers’ or sellers’ market.
I decided to look into it further for my neighborhood (the Reserve in McLean, VA) and see if the data supports this argument.   I pulled all the historical sales data for the Reserve including the contract dates and this is what I found.
Below is a link to a pdf file containing the raw data.
Some years show peak numbers (of contracts) in the Spring, and some actually show peak numbers in the Summer, Fall and/or Winter months.  Some showed no peak month.  There does not seem to be any clear pattern.  I don’t see any month that stands out over others with more contracts, but rather I see a pretty even distribution throughout the months of the year and a different peak month year to year.  Each year is different and there is no consistency. And, of course, historical data doesn’t always predict what will happen in future years.
Based on this information, it is clear that you can not time the market and you should look at the current market conditions as outlined in the above-list.
If you have any questions about this post, the real estate market in McLean, or just want to work with a knowledgeable and experienced real estate agent, please contact me at 703-403-8225 or taniahosmer@gmailcom.
05
Jun
11

Recently Listed in McLean, VA 22101 – This Past Week – May 29, 2011 – June 5, 2011

Recently Listed in McLean, VA 22101 – This Past Week

Nineteen properties were listed for sale this week (May 29 – June 5, 2011) in the 22101 postal code area of McLean, VA  with 2 already under contract.  Nine are listed for under $1,000,000. Eight are listed between $1,000,000 and $2,000,000 and 2 are listed for over $2,000,000.

Status ML# Address List Price Advertised Subdivision
CNTG/NO KO FX7615792 6811 FELIX ST $670,000 LEWINSVILLE HEIGHTS
ACTIVE FX7615423 7104 WESTBURY RD $679,000 WEST LEWINSVILLE HEIGHTS
ACTIVE FX7618056 1447 WAGGAMAN CIR $799,900 SALONA VILLAGE
ACTIVE FX7614563 1409 COLA DR $849,900 POTOMAC HILLS
ACTIVE FX7616775 1703 STRINE DR $849,900 DANA HEIGHTS
ACTIVE FX7615503 6629 MADISON MCLEAN DR $899,000 MADISON OF MCLEAN
ACTIVE FX7616475 1352 PINE TREE RD $949,900 WESTMONT
ACTIVE FX7619017 5906 MOSS WOOD LN $975,000 MANORS AT CHAIN BRIDGE
ACTIVE FX7615186 1223 POTOMAC SCHOOL RD $987,500 EVERMAY
CNTG/NO KO FX7615826 924 RIDGE DRIVE $1,185,000 LANGLEY OAKS
ACTIVE FX7618131 1707 JAMES PAYNE CIR $1,249,000 CHESTERBROOK HILLS
ACTIVE FX7617045 6804 OLD CHESTERBROOKE RD $1,458,000 MCLEAN MANOR
ACTIVE FX7618916 1343 KIRBY RD $1,499,000 KIRBY WOODS
ACTIVE FX7618000 6900 LUPINE LN $1,595,000 PARKVIEW HILLS
ACTIVE FX7614494 1594 MADDUX LN $1,649,000 CHESTERBROOK FARM
ACTIVE FX7613823 6504 DIVINE ST $1,749,000 EL NIDO ESTATES
ACTIVE FX7618079 813 CARRIE CT $1,795,000 LANGLEY FOREST
ACTIVE FX7615880 7212 FARM MEADOW CT $2,095,000 EVANS FARM
ACTIVE FX7618788 1173 DOLLEY MADISON BLVD $3,500,000 BALLANTRAE FARMS

Below is a link to the complete MRIS listings for these properties which include more details like lot size, number of bedrooms and bathrooms, tax assessment and photographs.

http://mrislistings.mris.com/Matrix/Public/Portal.aspx?k=1582934X2DOF&p=DE-141664909-83

If you have any questions about the information contained in my blog, please feel free to contact me at taniahosmer@gmail.com.

18
May
11

Market Analysis for McLean, VA 22101 – Quarter End 3/31/11

Market Analysis for McLean, VA 22101 – Quarter End 3/31/11

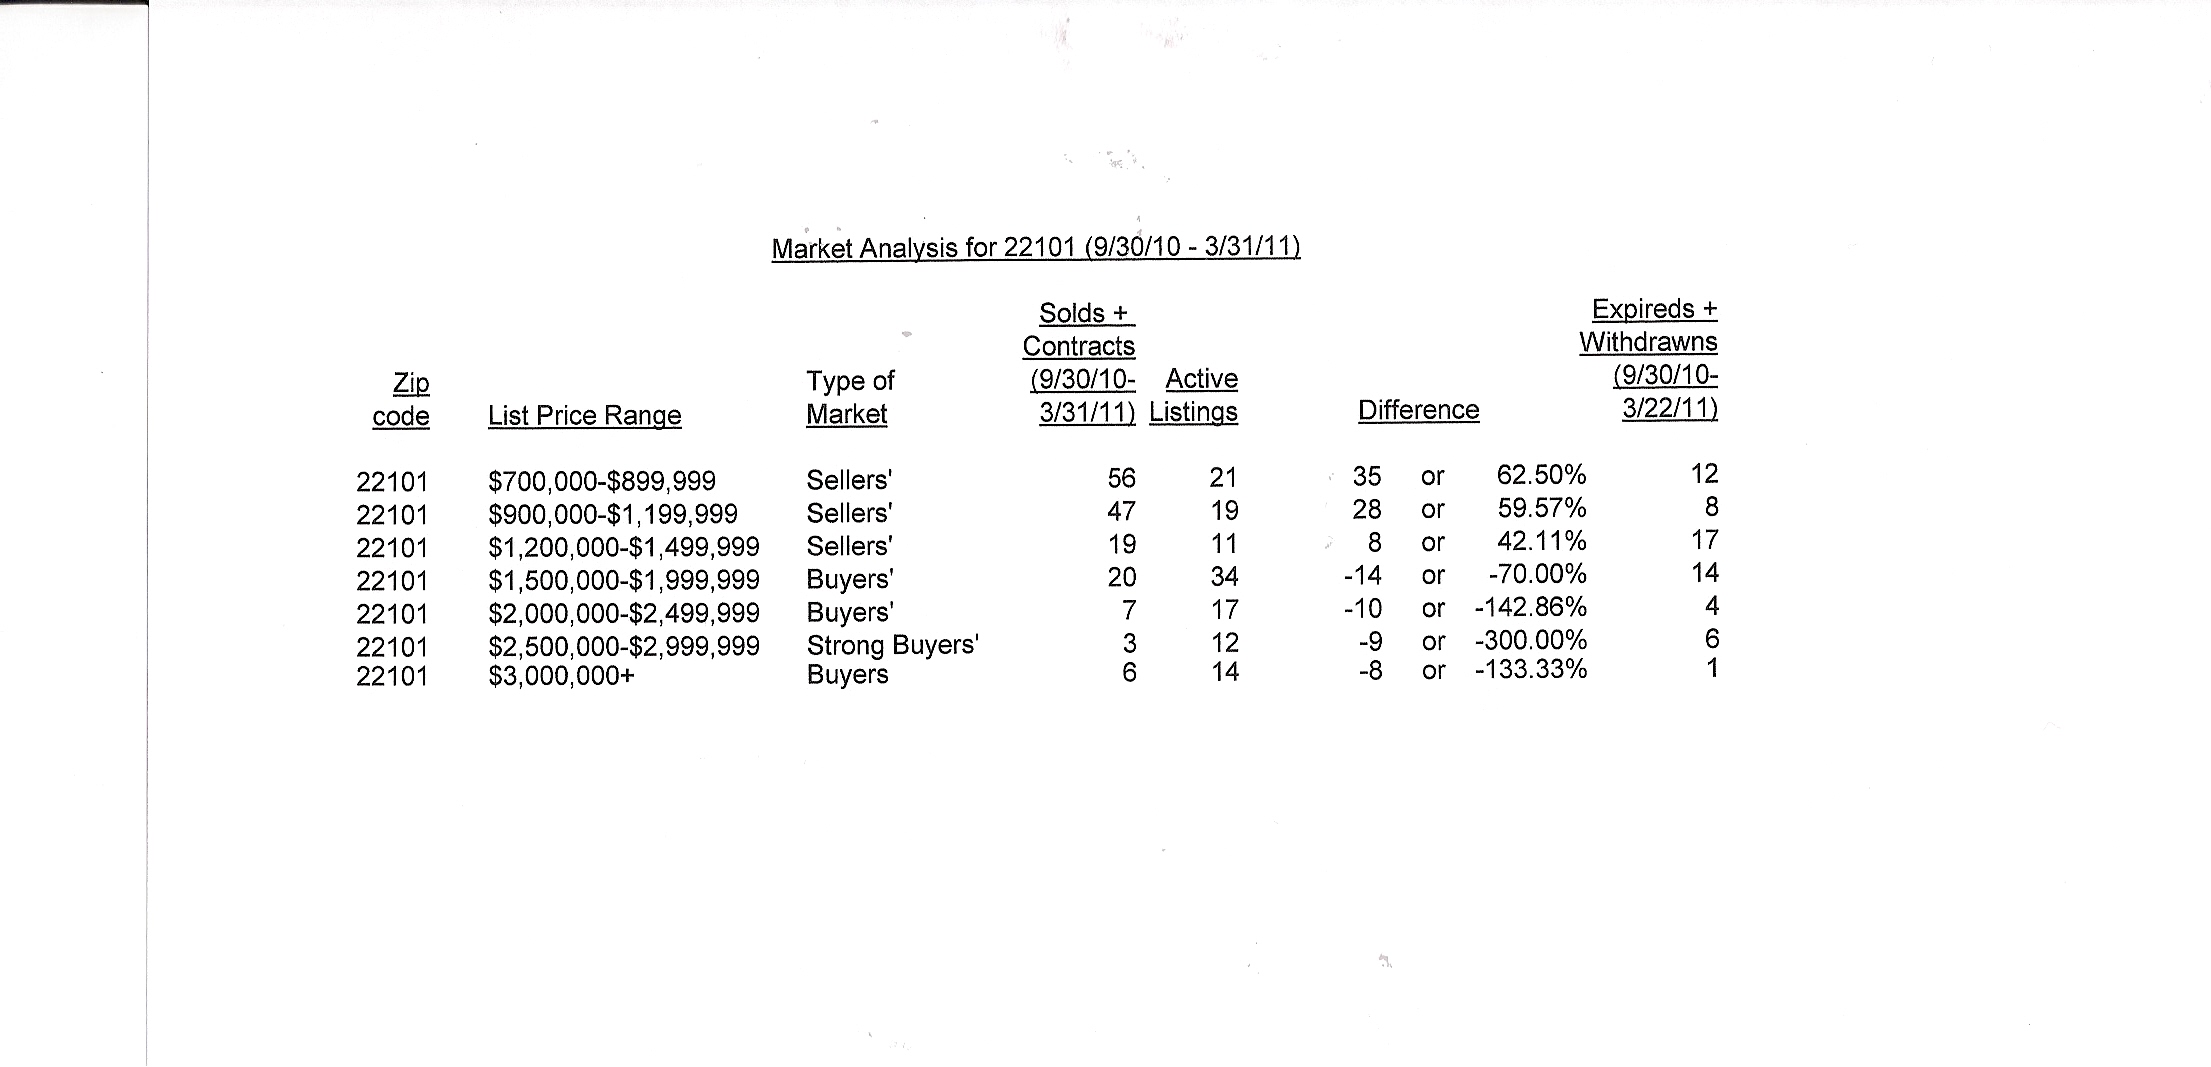
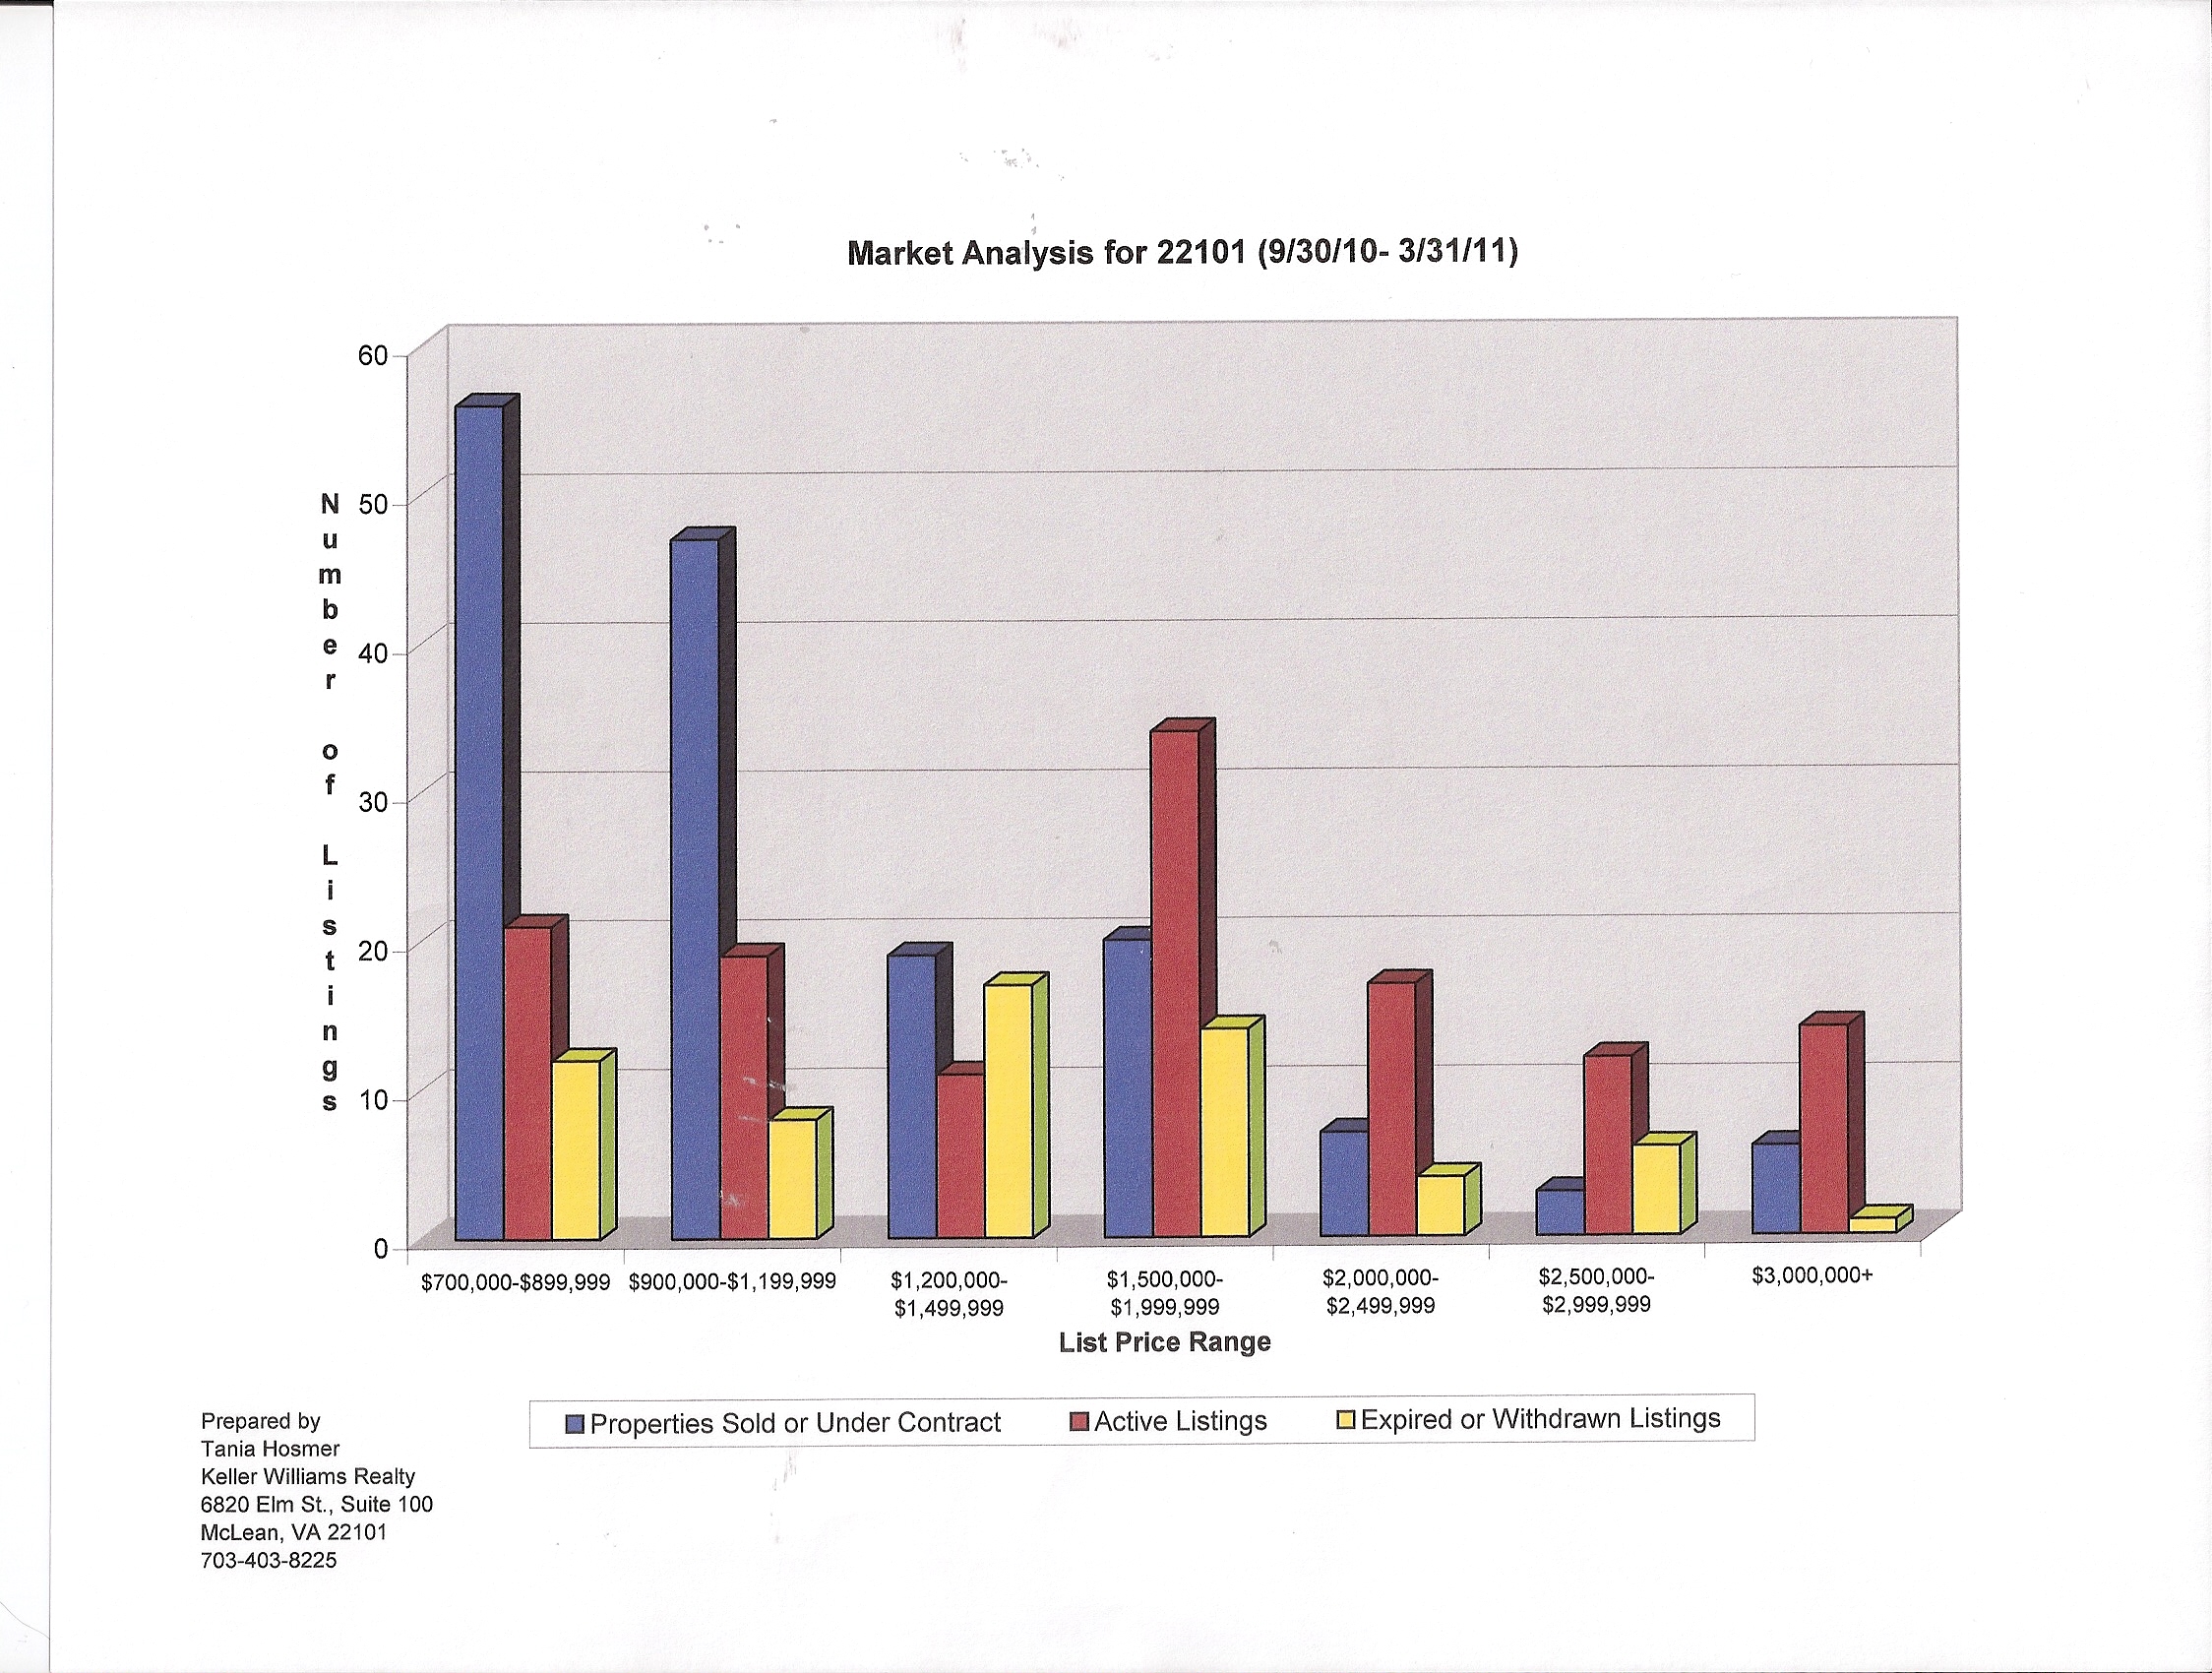
 The following table and chart compare the number of active listings (the supply) to the number of properties sold or under contract (the demand) in the local real estate market of McLean 22101 by price range for the period from 9/30/10 – 3/31/11.  To get an enlarged view of the table or chart, click on them.

This analysis is a snapshot in time.  The real estate market constantly changes just like any other market.  However, this is an accurate picture of the local real estate market at this point in time.  Based on the balance, the market can be characterized three ways:

Buyers’ Market – More Active Listings (Supply) than Sales and Under Contract Listings (Demand)

Balanced Market – An Equal Number of Active Listings (Supply) vs. Sales and Under Contract Listings (Demand)

Sellers’ Market – More Sales and Under Contract Listings (Demand) than Active Listings (Supply)

22102 Summary

  • $700,000 – $1,499,999 – Sellers’ Market
  • $1,200,000 – $1,499,999 – If you factor in the amount of withdrawn and expired listings, the number of active listings would increase by over 100% and shift the market from a sellers’ market to a buyers’ market.
  • $1,500,000 – $2,499,999 – Buyers’ Market (without factoring in the withdrawn and expired listings)
  • $1,500,000 – $1,999,999 – If you factor in the withdrawn and expired listings, the number of active listings would be over 2 times the number of sold plus under contract listings.
  • $2,000,000 – $2,499,999 – The number of active listings is over 3 times the number of sold and under contract listings combined.
  • $2,500,000 – $2,999,999 – Strong Buyers’ Market
  • $2,500,000 – $2,999,999 – There are 4 times the number of active listings as sold and under contract listings combined.
  • $3,000,000 and up – Buyers’ Market
  • $3,000,000 and up – There are over twice the number of active listings as sold and under contract listings combined.

If you have any questions about the McLean-Great Falls real estate market, please don’t hesitate to contact me at taniahosmer@gmail.com.


“it’s not your father’s real estate market anymore” ®

Tania Hosmer

Unknown's avatar

Tania grew up in Northern Virginia and is a life long resident of the area. She has lived in McLean, Virginia with her husband and 2 children since 2001. She holds a bachelor’s degree in Physics from Mary Washington College and an MBA in Finance from The George Washington University. Tania began her real estate career over 20 years ago. In addition to real estate sales, her experience includes managing residential renovation projects in the greater Washington area, planning and overseeing new residential construction and managing rental properties. After completing her MBA in 1996, she joined CIG International (a Washington-based residential real estate investment firm) as Vice President where she conducted extensive due diligence investigations of real estate investment opportunities and oversaw ongoing investment projects. Tania became a residential real estate agent in 2006.

Contact Information:

Tania Hosmer
Keller Williams Realty
6820 Elm Street, Suite 100
McLean, Virginia 22101
cell: 703-403-8225
email: taniahosmer@gmail.com
website: www.taniahosmer.com

Enter your email address to subscribe to this blog and receive notifications of new posts by email.

Join 277 other subscribers

Disclaimer:

If your home is currently listed with another broker, this is not intended as a solicitation of that listing.