Market Statistics – September 2011 – McLean, VA 22101
| Statistic | Values | YoY | MoM |
|---|---|---|---|
| Total Sold Dollar Volume | $34,333,195 | +83.2% | -29.28% |
| Closed Sales | 34 | +88.89% | -22.73% |
| Median Sold Price | $837,000 | -17.13% | -11.19% |
| Avg Sold Price | $1,009,800 | -3.01% | -8.48% |
| Avg Days on Market | 58 days | +28.89% | -12.12% |
| Avg Sold to Orig List Ratio | 94.2% | +1.68% | -1.16% |
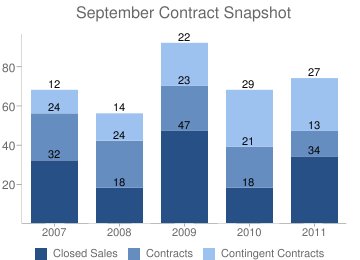
| Inventory | |||
| Sep-11 | Sep-10 | % Change | |
| Active Listings | 187 | 167 | 11.98% |
| New Listings | 77 | 49 | 57.14% |
| New Under Contracts | 7 | 12 | -41.67% |
| New Contingents | 23 | 14 | 64.29% |
| New Pendings | 30 | 26 | 15.38% |
| Total Pendings | 40 | 50 | -20% |
If you have any questions about these statistics, would like to discuss them or current real estate market conditions, I follow the market trends very closely and would be happy to discuss them with you. I can be reached by email at taniahosmer@gmail.com or phone at 703-403-8225.