Archive for the 'Uncategorized' Category


25
Aug
12

Great Falls, Virginia 22066 – Open Houses Saturday and Sunday – 8/25/12 and 8/26/12

Great Falls, Virginia 22066 – Open Houses Saturday and Sunday – 8/25/12 and 8/26/12

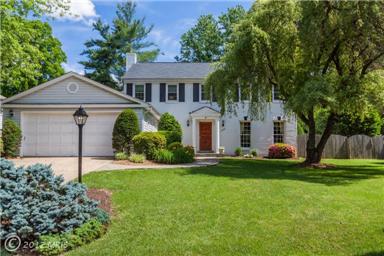
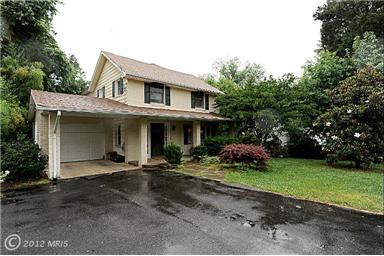
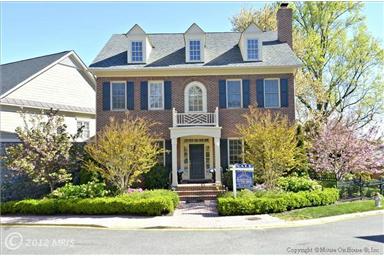
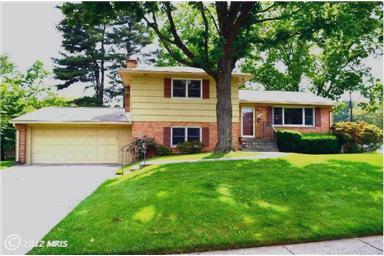
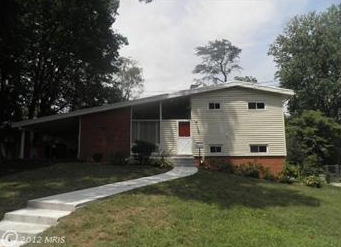
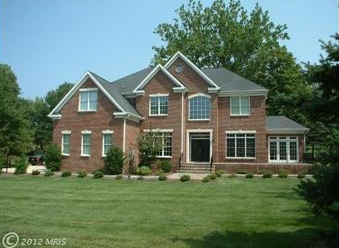
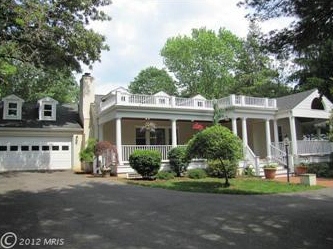
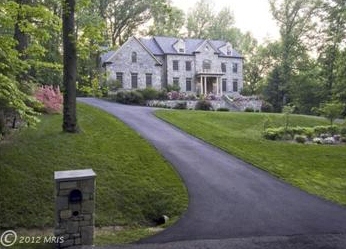
There are nineteen (19) open houses in Great Falls, Virginia 22066 scheduled for Saturday and Sunday, August 25 and 26, 2012.  Here is a link to the listings:

http://mrislistings.mris.com/Matrix/Public/Portal.aspx?k=1582934X2FSH&p=DE-176669910-100

They can be mapped by clicking on the map button at the bottom of the list of properties once you click on the above link to the list.

If you would like any additional information about these listing, please contact me at TaniaHosmer@gmail.com.

24
Aug
12

July Market Statistics – McLean VA 22101

Tania Hosmer's avatarMcLean Real Estate News

StatisticValuesYoYMoM
Total Sold Dollar Volume$39,914,294+14.48%-37.95%
Closed Sales38+2.7%-34.48%
Median Sold Price$823,500+1.79%-11.55%
Avg Sold Price$1,050,376+11.47%-5.3%
Avg Days on Market68 days+11.48%-20.93%
Avg Sold to Orig List Ratio97.92%+2.82%+1.36%


Inventory
Jul-12Jul-11%Change
Active Listings144165-12.73%
New Listings5463-14.29%
New Under Contracts1011-9.09%
New Contingents332626.92%
New Pendings433716.22%
All Pendings665324.53%

View original post

24
Aug
12

June Market Statistics for McLean, VA 22101 and 22102

June Market Statistics for McLean, VA 22101 and 22102

22102 Statistics

Statistic Values YoY MoM
Total Sold Dollar Volume $35,759,000 +0.8% +58.65%
Closed Sales 37 +32.14% +27.59%
Median Sold Price $818,500 +8.41% +57.4%
Avg Sold Price $966,459 -23.72% +24.35%
Avg Days on Market 92 days +29.58% +135.9%
Avg Sold to Orig List Ratio 94.36% -0.43% -3.86%
Inventory
Jun-12 Jun-11 % Change
Active Listings 120 125 -4.00%
New Listings 40 32 25.00%
New Under Contracts 12 9 33.33%
New Contingents 21 25 -16.00%
New Pendings 33 34 -2.94%
All Pendings 52 52 0.00%

22101 Statistics

Inventory
Jun-12 Jun-11 % Change
Active   Listings 151 164 -7.93%
New   Listings 65 67 -2.99%
New Under   Contracts 8 14 -42.86%
New   Contingents 23 26 -7.69%
New   Pendings 32 40 -20.00%
All   Pendings 67 54 24.07%
Statistic Values YoY MoM
Total Sold Dollar Volume $64,329,656 +36.12% +22.57%
Closed Sales 58 +16% +18.37%
Median Sold Price $931,000 +16.74% +2.87%
Avg Sold Price $1,109,132 +17.34% +3.55%
Avg Days on Market 86 days +75.51% +91.11%
Avg Sold to Orig List Ratio 96.61% +2.01% +0.21%
21
Aug
12

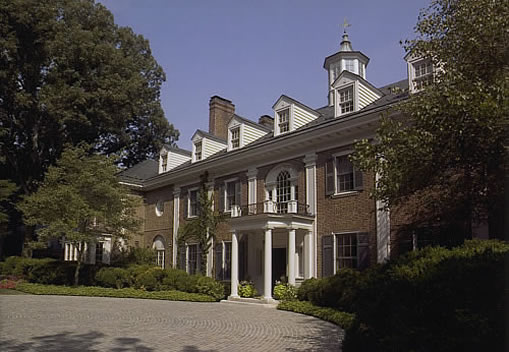
Merrywood on the Potomac

Merrywood on the Potomac

Steve Case, the former chairman and CEO of AOL purchased Merrywood in 1999, the
childhood home of Jacqueline Kennedy Onassis. The seven acre waterfront estate
in McLean belonged to Jackie’s mother and stepfather, Janet Bouvier Auchincloss
and Hugh D. Auchincloss. Built in the 1920’s, the nine-bedroom estate has since
been extensively renovated and refurbished by Washington designer Victor
Shargai. It features a 5,000 square-foot pool house and a tennis court.
Washington Life last reported on the home in December of 1999 when Washington
Fine Properties listed the estate for real-estate developer Alan Kay and his
wife Dianne, who sold it for slightly more than $15,000,000 to William Conway, a
founder and managing director of the Carlyle Group. Case reportedly paid Conway
$24.5 million.

The home has been described as a mock-Georgian brick house
set among 1/2 dozen acres of woods on the high Potomac palisades. From terraced
lawns, there was a steep rocky drop to the river.

More information and photos:

http://www.pinkpillbox.com/merrywood.htm

http://www.netplaces.com/jacqueline-kennedy-onassis/growing-up-ingenue/life-on-the-country-estates.htm

Old Time magazine article about Merrywood:

http://www.time.com/time/magazine/article/0,9171,939370,00.html

21
Aug
12

Homes Sold in McLean VA 22101 – week of 7/30/12 – 8/6/12

Homes Sold in 22101 – 7/30/12 – 8/6/12

 
Eleven (11) properties settled the week of 7/30/12 – 8/6/12 in McLean, Virginia 22101:
 
Address Close Price Subdiv Beds Baths
6514 Old Dominion Dr $1,750,000 Estates at F 6 5
6804 Broyhill St. $865,000 Lewinsville 5 3
1924 Virginia Ave $1,715,000 Franklin Park 5 4
1497 Teague Dr. $1,650,000 Evans Farm 5 5
1405 Pathfinder Ln $682,000 Broyhills MC 4 3
1954 Valleywood Rd $1,150,000 Franklin Park 4 4
6450 Jefferson Pl $850,000 Brookhaven 4 3
1724 Susquehannock Dr $740,000 West Lewinsville 4 3
6132 Ramshorn Dr $1,045,000 Dolley Madison 4 3
1805 Franklin Ave $645,750 Chesterbrook 3 3
1803 Lansing Ct $721,000 Birchwood 4 3


Photos and Information
 
6450 Jefferson Pl
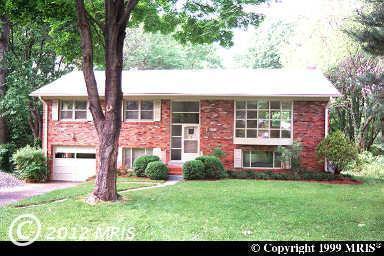
The property located at 6450 Jefferson Pl, McLean, VA 22101 sold on 8/6/12 for $776,000.  It is a single family home located in Brookhaven and has 4 bedrooms and 3 bathrooms.
Here is a link to the complete listing:
 
1803 Lansing Ct.
 
The property located at 1403 Lansing Ct, McLean, VA 22101 sold on 8/3/12 for $721,000.  It is a single family home located in Birchwood and has 4 bedrooms and 3 bathrooms.
 
Here is a link to the complete listing:
 
 
1924 Virginia Ave.
 
The property located at 1924 Virginia Ave, McLean, VA 22101 sold for $1,715,000 on 8/1/12.  It is a single family home in the Franklin Park area and has 5 bedrooms and 4 bathrooms.
 
Here is a link to the complete listing:
 
 
1405 Pathfinder Ln
 
The property located at 1405 Pathfinder Ln, McLean, VA 22101 sold on 8/1/12 for $682,000.  It is a single family home located in Broyhills MC and has 4 bedrooms and 3 bathrooms.
 
Here is a link to the complete listing:
 
 
1954 Valleywood Rd
 
The property located at 1954 Valleywood Rd, McLean, VA 22101 sold on 8/1/12 for $1,150,000.  It is a single family home located in Franklin Park and has 4 bedrooms and 4 bathrooms.
 
Here is a link to the complete listing:
 
 
6514 Old Dominion Dr
 
The property located at 6514 Old Domnion Dr, McLean, VA 22101 sold on 7/31/12 for $1,750,000.  It is a single family home located in the Estates at F subdivision and has 6 bedrooms and 5 bathrooms.
 
Here is a link to the complete listing:
 
 
6804 Broyhill St
 
The property located at 6804 Broyhill St, McLean, Va 22101 sold on 7/31/12 for $865,000.  It is a single family home located in Lewinsville and has 5 bedrooms and 3 bathrooms.
 
Here is a link to the complete listing:
 
 
6132 Ramshorn Dr.
 
The property located at 6132 Ramshorn Dr, McLean, VA 22101 sold on 7/31/12 for $1,045,000.  It is a single family home located in Dolley Madison and has 4 bedrooms and 3 bathrooms.
 
Here is a link to the complete listing:
 
 
1805 Franklin Ave
 
The property located at 1805 Franklin Ave, McLean, VA 22101 sold on 7/31/12 for $645,750.  It is a single family home located in Chesterbrook and has 3 bedrooms and 3 bathrooms.
 
Here is a link to the complete listing:
 
 
1497 Teague Dr.
 
The property located at 1497 Teague, McLean, VA 22101 sold on 7/30/12 for $1,650,000.  It is a single family home located in Evans Farm and has 5 bedrooms and 5 bathrooms.
 
Here is a link to the complete listing:
 
 
1724 Susquehannock Dr.
 
The property located at 1724 Susquehannock Dr, McLean, VA 22101 sold on 7/30/12 for $740,000.  It is a single family home located in West Lewinsville and has 4 bedrooms and 3 bathrooms.
 
Here is a link to the complete listing:


For more information on these or any other listings in the McLean-Great Falls, VA area, please contact Tania at 703-403-8225 or taniahosmer@gmail.com.
 

21
Aug
12

Homes Listed for Sale in McLean VA 22101 – 7/30/12 – 8/6/12

Nineteen (19) homes were listed for sale the week of July 30, 2012 – August 6, 2012 in McLean, VA 22101:

 
Address List Price Sudivision Beds Baths
7201 Dulany Dr $32,000,000 Elmwood Estate 8 9
635 River Crest Dr $1,650,000 River Oaks 6 4
6216 Park Rd $1,799,000 Franklin Park 5 5
1620 41st St N $799,000 Gold Club MA 4 2
6318 Mori St $859,999 Potomac Hill 4 3
1443 Harvest Cross $1,959,000 Evans Farm 5 4
7325 Yates Ct $1,100,000 McLean Knol 4 3
6528 Beverly Ave $719,000 Grass Ridge 3 2
6800 Fleetwd #514 $249,900 McLean House 1 1
1450 Emersn #301 $1,195,000 Palladium At 3 2
1105 Harvey Rd $2,450,000 Langley Farm 3 4
7449 Dulany Dr $2,699,000 Elmwood Estate 6 7
7020 Green Oak $9,200,000 River Oaks 8 8
6641 Holmes Pl $1,200,000 Bryn Mawr 3 4
6105 Still Water $1,750,000 Solitaire 5 4
6848 Strata St $645,000 Devon Park 4 2
6718 Benjamin St $3,875,000 Langley Forest 7 7
943 Douglass Dr $2,399,900 Langley Forest 5 4
1917 Birch Rd $975,000 Chesterbrook 4 4


Photos and Information
 
6216 Park Rd
 
The property located at 6216 Park Rd, McLean, VA 22101 was put on the market on 8/6/12 for $1,799,000.  It is a single family home located in the Franklin Park subdivision and has 5 bedrooms and 5 bathrooms.
 
Here is a link to the complete listing:
 
 
6718 Benjamin St.
 
The property located at 6718 Benjamin St, McLean, VA 22101 was put on the market on 8/6/12 for $3,875,000.  It is a single family home located in Langley Forest and has 7 bedrooms and 7 bathrooms.
 
Here is a link to the complete listing:
 
 
635 River Crest
635 River Crest Dr, McLean, VA 22101 was put on the market on 8/3/12 for $1,650,000.  It is a single family home located in the River Oaks subdivision and has 6 bedrooms and 4 bathrooms.
 
Here is a link to the complete listing:
 
 
7325 Yates Ct
 
The property located at 7325 Yates Ct, McLean, VA 22101 was put on the market on 8/3/12 for $1,100,000.  It is a single family home located in McLean Knol and has 4 bedrooms and 3 bathrooms.
 
Here is a link to the complete listing:
 
 
6641 Holmes Place
 
The property located at 6641 Holmes Dr, McLean, VA 22101 was put on the market on 8/3/12 for $1,200,000.  It is a single family home located in Bryn Mawr and has 3 bedrooms and 4 bathrooms.
 
Here is a link to the complete listing:
 
 
6848 Strata St.
 
The property located at 6848 Strata Dr, McLean, VA 22101 was put on the market on 8/3/12 for $645,000.  It is a single family home located in Devon Park and has 4 bedrooms and 2 bathrooms.
 
Here is a link to the complete listing:
 
 
943 Douglass Dr
 
The property located at 943 Douglass Dr, McLean, VA 22101 was put on the market on 8/3/12 for $2,399,900.  It is a single family home located in Langley Forest and has 5 bedrooms and 4 bathrooms.
 
Here is a link to the complete listing:
 
 
1917 Birch Rd
 
The property located at 1917 Birch Rd, McLean, VA 22101 was put on the market on 8/3/12 for $975,000.  It is a single family home located in Chesterbrook and has 4 bedrooms and 4 bathrooms.
 
Here is a link to the complete listing:
 
 
6800 Fleetwood Rd #514
 
The property located at 6800 Fleetwood Rd #514, McLean, VA 22101 was put on the market on 8/2/12 for $249,900.  It is an apartment and has 1 bedroom and 1 bathroom.
 
Here is a link to the complete listing:
 
 
1105 Harvey Rd
 
The property located at 1105 Harvey Rd, McLean, VA 22101 was put on the market on 8/2/12 for $2,450,000.  It is a single family home located in Langley Farms and has 3 bedrooms and 4 bathrooms.
 
Here is a link to the complete listing:
 
 
7449 Dulany Dr
 
The property located at 7449 Dulany Dr, McLean, VA 22101 was put on the market on 8/2/12 for $2,699,000.  It is a single family home located in Elmwood Estates and has 6 bedrooms and 7 bathrooms.
 
Here is a link to the complete listing:
 
 
7020 Green Oak Dr
 
The property located at 7020 Green Oak Dr, McLean, VA 22101 was put on the market on 8/2/12 for $9,200,000.  It is a single family home located in River Oaks and has 8 bedrooms and 8 bathrooms.
 
Here is a link to the complete listing:
 
 
6105 Still Water Way
 
The property located at 6105 Still Water Way, McLean, VA 22101 was put on the market on 8/2/12 for $1,750,000.  It is a single family home located in Solitaire and has 5 bedrooms and 4 bathrooms.
 
Here is a link to the complete listing:
 
 
7201 Dulany Dr
 
The property located at 7201 Dulany Dr, McLean, VA 22101 was put on the market on 8/1/12 for $32,000,000.  It is a single family home located in the Elmwood Estate area and has 8 bedrooms and 9 bathrooms.
 
Here is a link to the complete listing:
 
 
1443 Harvest Crossing Dr.
 
The property located at 1443 Harvest Crossing Dr, McLean, VA 22101 was put on the market on 8/1/12 for $1,959,000.  It is a single family home located in the Evans Farm subdivision and has 5 bedrooms and 4 bathrooms.
 
Here is a link to the complete listing:
 
 
6528 Beverly Ave
 
The property located at 6528 Beverly Ave, McLean, VA 22101 was put on the market on 8/1/12 for $719,000.  It is a single family home located in Grass Ridge and has 3 bedrooms and 2 bathrooms.
 
Here is a link to the complete listing:
 
 
1450 Emerson Ave #301
No Description Provided.
 
The property located at 1450 Emerson ave #301, McLean, VA 22101 was put on the market on 8/1/12 for $1,195,000.  It is an apartment with 2 bedrooms and 2 bathrooms.
 
Here is a link to the complete listing:
 
 
1620 41st St N
 
The property located at 1620 41st st, McLean, VA 22101 was put on the market on 7/31/12 for $799,000.  It is a single family home located in the Gold Club subdivision and has 4 bedrooms and 2 bathrooms.
 
Here is a link to the complete listing:
 
 
6318 Mori St.
 
The property located at 6318 Mori St was put on the market on 7/31/12 for $859,999.  It is a single family home located in Potomac Hill and has 4 bedrooms and 3 bathrooms.
 
Here is a link to the complete listing:


21
Aug
12

July Market Statistics – McLean VA 22101

Statistic Values YoY MoM
Total Sold Dollar Volume $39,914,294 +14.48% -37.95%
Closed Sales 38 +2.7% -34.48%
Median Sold Price $823,500 +1.79% -11.55%
Avg Sold Price $1,050,376 +11.47% -5.3%
Avg Days on Market 68 days +11.48% -20.93%
Avg Sold to Orig List Ratio 97.92% +2.82% +1.36%


Inventory
Jul-12 Jul-11 %Change
Active Listings 144 165 -12.73%
New Listings 54 63 -14.29%
New Under Contracts 10 11 -9.09%
New Contingents 33 26 26.92%
New Pendings 43 37 16.22%
All Pendings 66 53 24.53%
18
Aug
12

Just Sold by Tania Hosmer – 808 Towlston Rd, McLean, Virginia 22102

Just Sold by Tania Hosmer  – 808 Towlston Rd, McLean, Virginia 22102

The property located at 808 Towlston Rd, McLean, Virginia  22102 sold on 8/10/12 for $870,000.  It was on the market for 46 days.  It was originally listed for $950,000 on 6/1/12.

For more information on this listing, here is the link to the complete listing:

http://mrislistings.mris.com/DE.asp?k=3074721XR46b&p=DE-175901044-934

Here is a link to the virtual tour:

http://www.homevisit.com/mlsTour/?id=59031

If you have any questions about this or any other listing in the McLean or Great Falls area, please feel free to contact me at TaniaHosmer@gmail.com or 703-403-8225.

31
Jul
12

State of the McLean – Great Falls Real Estate Market – Quarter End 6/30/12

State of the McLean – Great Falls Real Estate Market

(12/31/11-6/30/12)

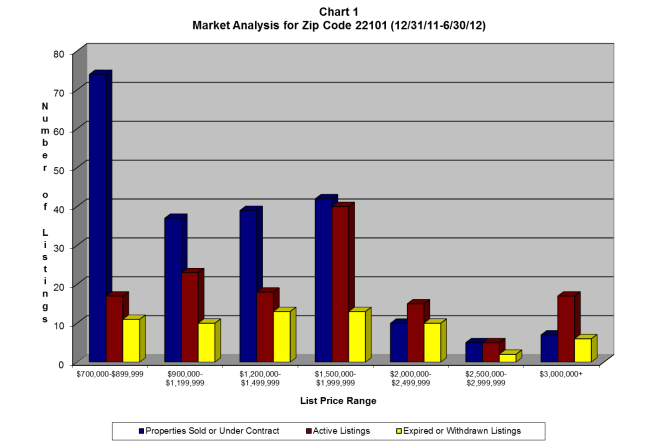
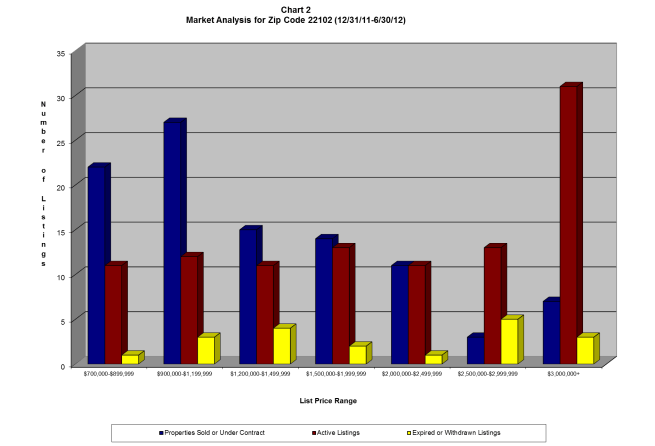
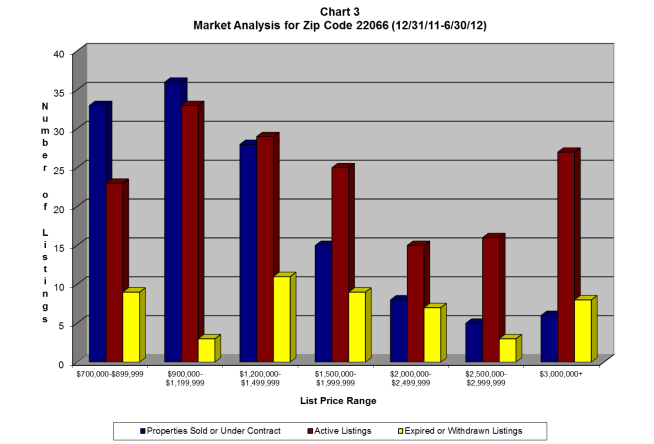
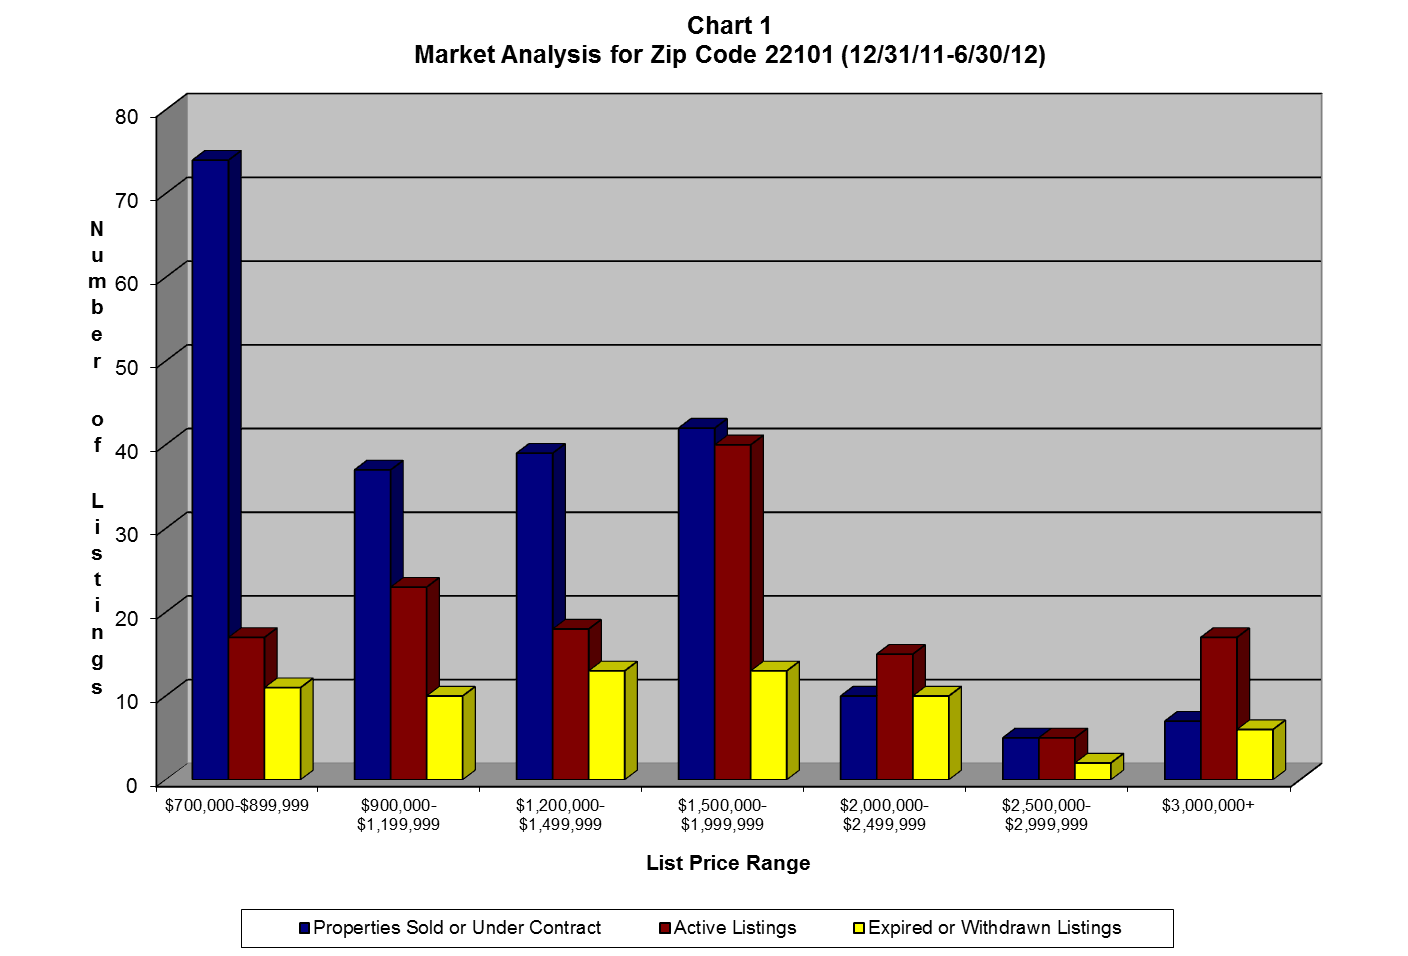
 Tables 1, 2 and 3 and Charts 1, 2 and 3 compare the number of active listings (the supply) to the number of properties sold or under contract (the demand) in the local real estate markets of McLean and Great Falls (zip codes 22101, 22102 and 22066) by price range for the period from 12/31/11 – 6/30/12.  The following chart depicts the relationship between supply, demand and price.
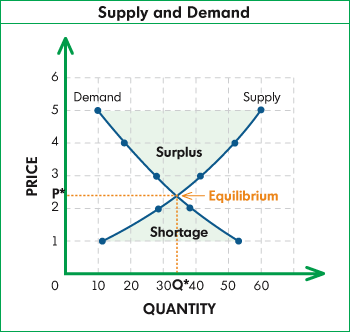
Based on the current data, the real estate markets in our area can be characterized in one of three ways:

Buyers’ Market – More Active Listings (Supply) than Sold and Under Contract Listings (Demand)

Balanced Market – An Equal Number of Active Listings (Supply) as compared to Sold and Under Contract Listings (Demand)

Sellers’ Market – More Sold and Under Contract Listings (Demand) than Active Listings (Supply)

Table 1

Table 1
Market Analysis for Zip Code 22101 (12/31/11 – 6/30/12)
Solds + Expireds +
Contracts Withdrawns
Zip Type of (12/31/11 Active (12/31/11-
Code List Price Range Market -6/30/12)   Listings Difference 6/30/12)
22101 $700,000-$899,999 Sellers’ 74 17 57 or 77.03% 11
22101 $900,000-$1,199,999 Sellers’ 37 23 14 or 37.84% 10
22101 $1,200,000-$1,499,999 Sellers’ 39 18 21 or 53.85% 13
22101 $1,500,000-$1,999,999 Balanced 42 40 2 or 4.76% 13
22101 $2,000,000-$2,499,999 Buyers’ 10 15 -5 or -50.00% 10
22101 $2,500,000-$2,999,999 Balanced 5 5 0 or 0.00% 2
22101 $3,000,000+ Strong Buyers’ 7 17 -10 or -142.86% 6

Summary of Zip Code 22101

•             $700,000 – $899,999 – Sellers’ Market. The number of homes sold between 12/31/11 and 6/30/12 combined with the number of properties currently under contract is more than 4 times the number of homes currently on the market (active listings). If you factor in the property listings that expired or were withdrawn from the market, there are still more than twice the number of sold properties plus under contract properties than currently listed properties, and this price range is still a sellers’ market.

•             $900,000 – $1,199,999 – Sellers’ Market. The number of homes that sold between 12/31/11 and 6/30/12 plus the number of currently under contract properties is more than 1 ½ times the number of homes currently listed for sale. If you factor in the property listings that were withdrawn from the market or listings that expired, this price range becomes closer to a balanced market.

•             $1,200,000 – $1,499,999 – Sellers’ Market. The number of homes that sold between 12/31/11 and 6/30/12 plus the number of currently under contract properties is more than twice the number of homes currently listed for sale. If you factor in the properties that were withdrawn from the market or listings that expired, this price range is closer to a balanced market.

•             $1,500,000 – $1,999,999 – Balanced Market. The number of homes currently on the market is slightly more than the number of homes sold between 12/31/11 and 6/30/12 and under contract properties combined, so it is effectively a balanced market. If you factor in the property 13 listings that were withdrawn or expired, this price range would be a buyers’ market.

•             $2,000,000 – $2,499,999 – Buyers’ Market. The number of homes currently on the market is 1½ times the number of properties that sold between 12/31/11 and 6/30/12 combined with the number of homes currently under contract. If you factor in the property listings that were withdrawn or expired, the number of active listings would be 2 ½ times the number of sold plus under contract listings and this price range would be a stronger buyers’ market.

•             $2,500,000 – $2,999,999 – Balanced Market. The number of homes currently listed for sale is equal to the number of homes sold between 12/31/11 and 6/30/12 plus the number of properties currently under contract. If you factor in the properties that were withdrawn from the market or expired listings, this price range shifts from a balanced market to a buyers’ market.

•             $3,000,000 and up – Buyers’ Market. The number of homes currently on the market is more than 2 times the number of properties sold between 12/31/11 and 6/30/12 and the number of currently under contract listings combined. The number of withdrawn and expired listings, if they were put back on the market, would make the number of active listings more than 3 times the number of sold plus under contract listings and make this price range a stronger buyers’ market.

Table 2

Table 2
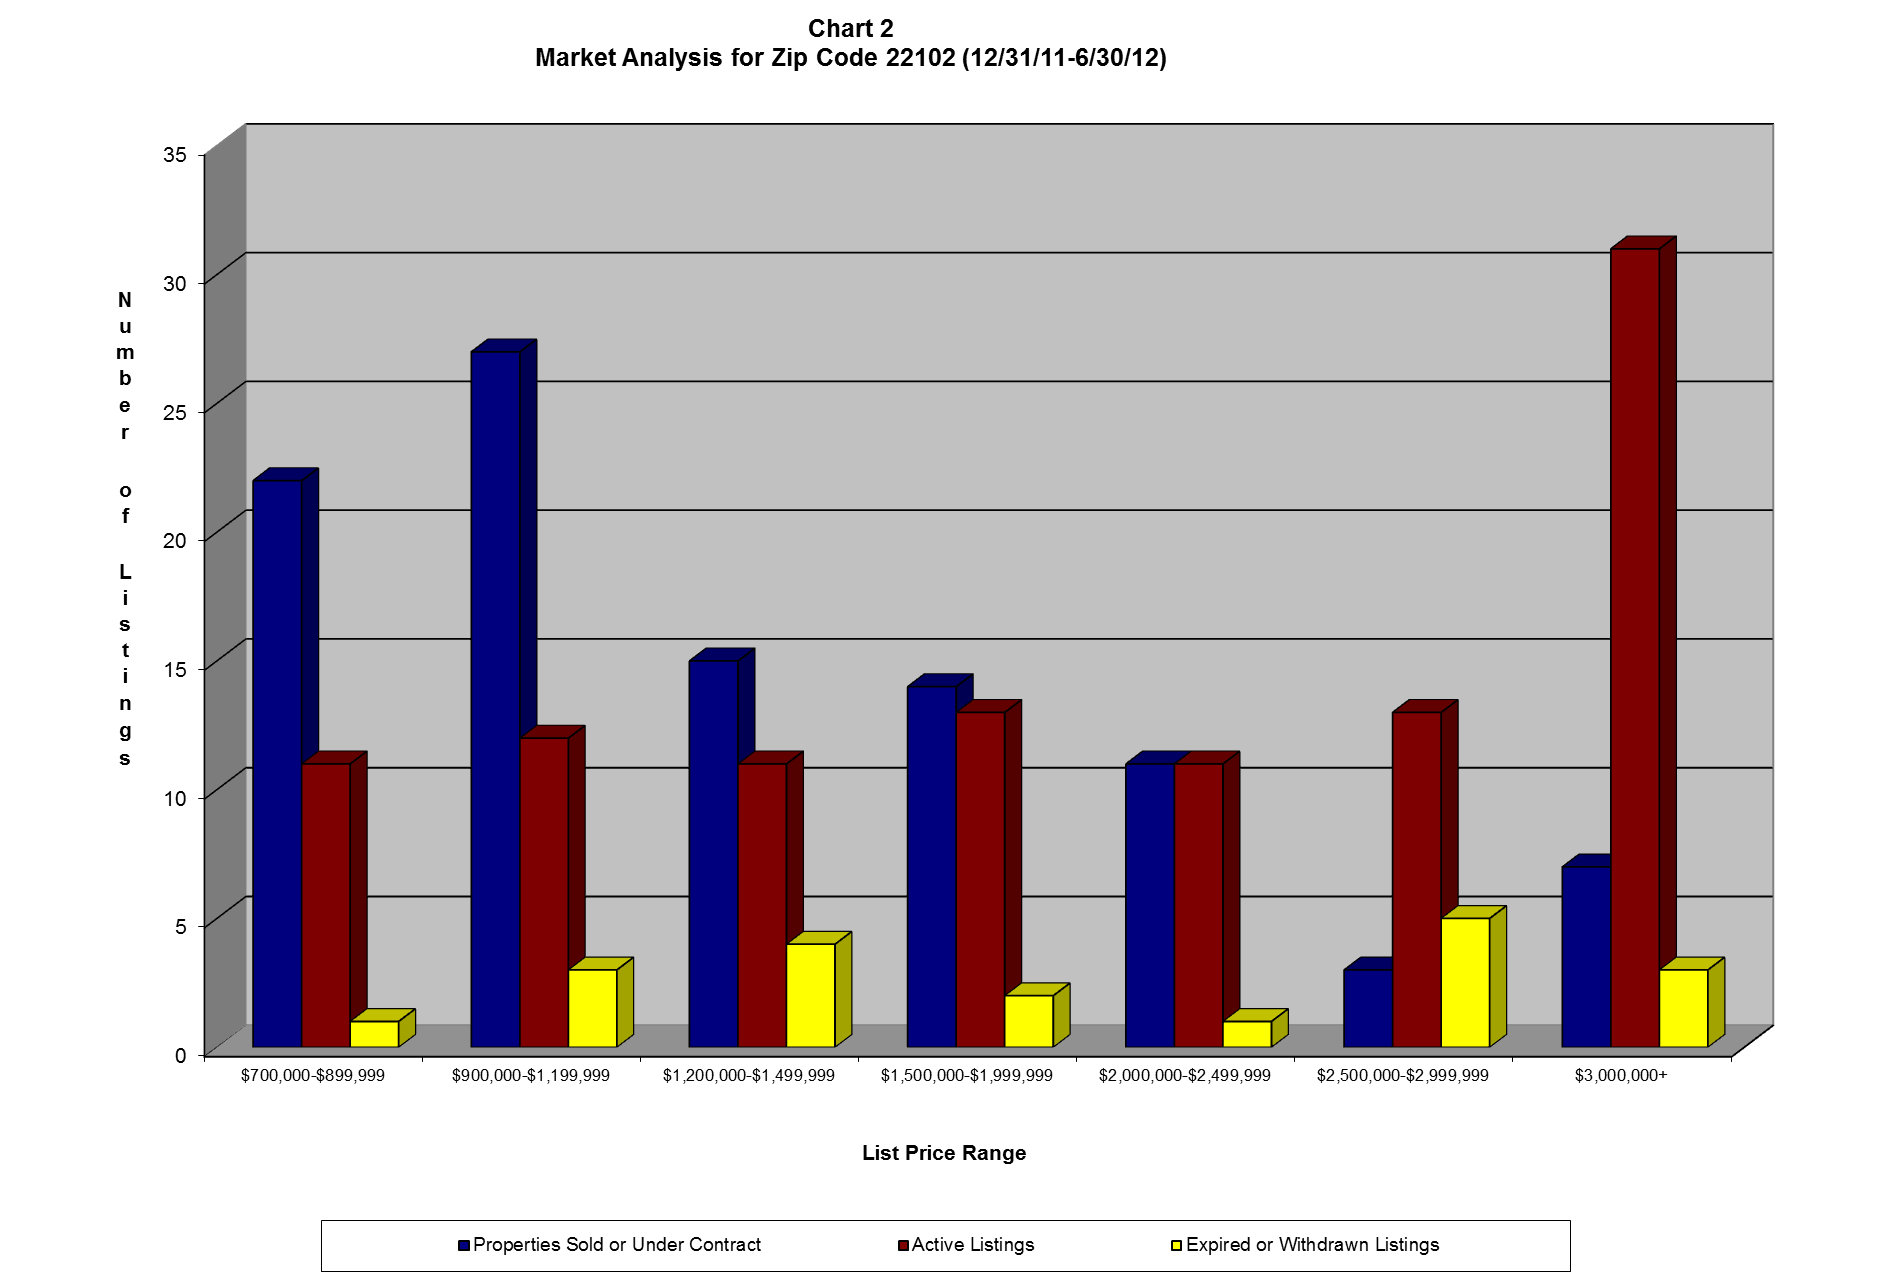
Market Analysis for Zip Code 22102 (12/31/11 – 6/30/12)
Solds + Expireds +
Contracts Withdrawns
Zip Type of (12/31/11 Active (12/31/11-
Code List Price Range Market -6/30/12) Listings Difference 6/30/12)
22102 $700,000-$899,999 Sellers’ 22 11 11  or 50.00% 1
22102 $900,000-$1,199,999 Sellers’ 27 12 15  or 55.56% 3
22102 $1,200,000-$1,499,999 Sellers’ 15 11 4  or 26.67% 4
22102 $1,500,000-$1,999,999 Balanced 14 13 1  or 7.14% 2
22102 $2,000,000-$2,499,999 Buyers’ 11 11 0  or 0.00% 1
22102 $2,500,000-$2,999,999 Strong Buyers’ 3 13 -10  or -333.33% 5
22102 $3,000,000+ Strong Buyers’ 7 31 -24  or -342.86% 3

Summary of Zip Code 22102

•             $700,000 – $899,999 – Sellers’ Market.  The number of properties sold between 12/31/11 and 6/30/12 combined with the number of under contract listings is twice the number of homes currently on the market (active listings).  If you factor in the 1 property listing that expired, there are still close to 2 times the number of sold properties plus under contract properties as the number of active listings and the price range is still a sellers’ market.

•             $900,000 – $1,199,999 – Sellers’ Market.  The number of properties sold between 12/31/11 and 6/30/12 combined with the number of under contract listings is more than twice the number of homes currently on the market.  If you factor in the properties that were withdrawn from the market and listings that expired, this price range stays a sellers’ market.

•             $1,200,000 – $1,499,999 – Sellers’ Market.  The number of properties sold between 12/31/11 and 6/30/12 plus the number of under contract listings is slightly more than the number of homes for sale.  If you factor in the properties that were withdrawn from the market and listings that expired, this price range shifts from a sellers’ market to a balanced market.

•             $1,500,000 – $1,999,999 – Balanced Market.  There is an almost equal number of homes for sale as number of homes sold between 12/31/11 and 6/30/12 plus under contract homes.  If you factor in the number of properties that were withdrawn from the market and listings allowed to expire, this price range stays a balanced market.

•             $2,000,000 – $2,499,999 – Balanced Market.  The number of properties for sales is equal to the number of homes sold between 12/31/11 and 6/30/12 plus the number of homes currently under contract.  If you factor in the properties that were withdrawn from the market and listings that expired, this price range stays a balanced market.

•             $2,500,000 – $2,999,999 – Strong Buyers’ Market.  The number of homes listed for sale is more than 4 times the number of homes sold between 12/31/11 and 6/30/12 combined with the number of properties currently under contract.  If you factor in the properties that were withdrawn from the market and listings that expired, there would be 6 times the number of homes on the market as sold homes combined with the number of properties currently under contract and it would be an even stronger buyers’ market.

•             $3,000,000 and up – Strong Buyers’ Market.  The number of homes currently listed for sale is more than 4 times the number of homes sold between 12/31/11 and 6/30/12 plus the number of homes currently under contract.

Table 3

Table 3
Market Analysis for Zip Code 22066 (12/31/11 – 6/30/12)
Solds + Expireds +
Contracts Withdrawns
Zip Type of (12/31/11 Active (12/31/11-
Code List Price Range Market -6/30/12) Listings Difference 6/30/12)
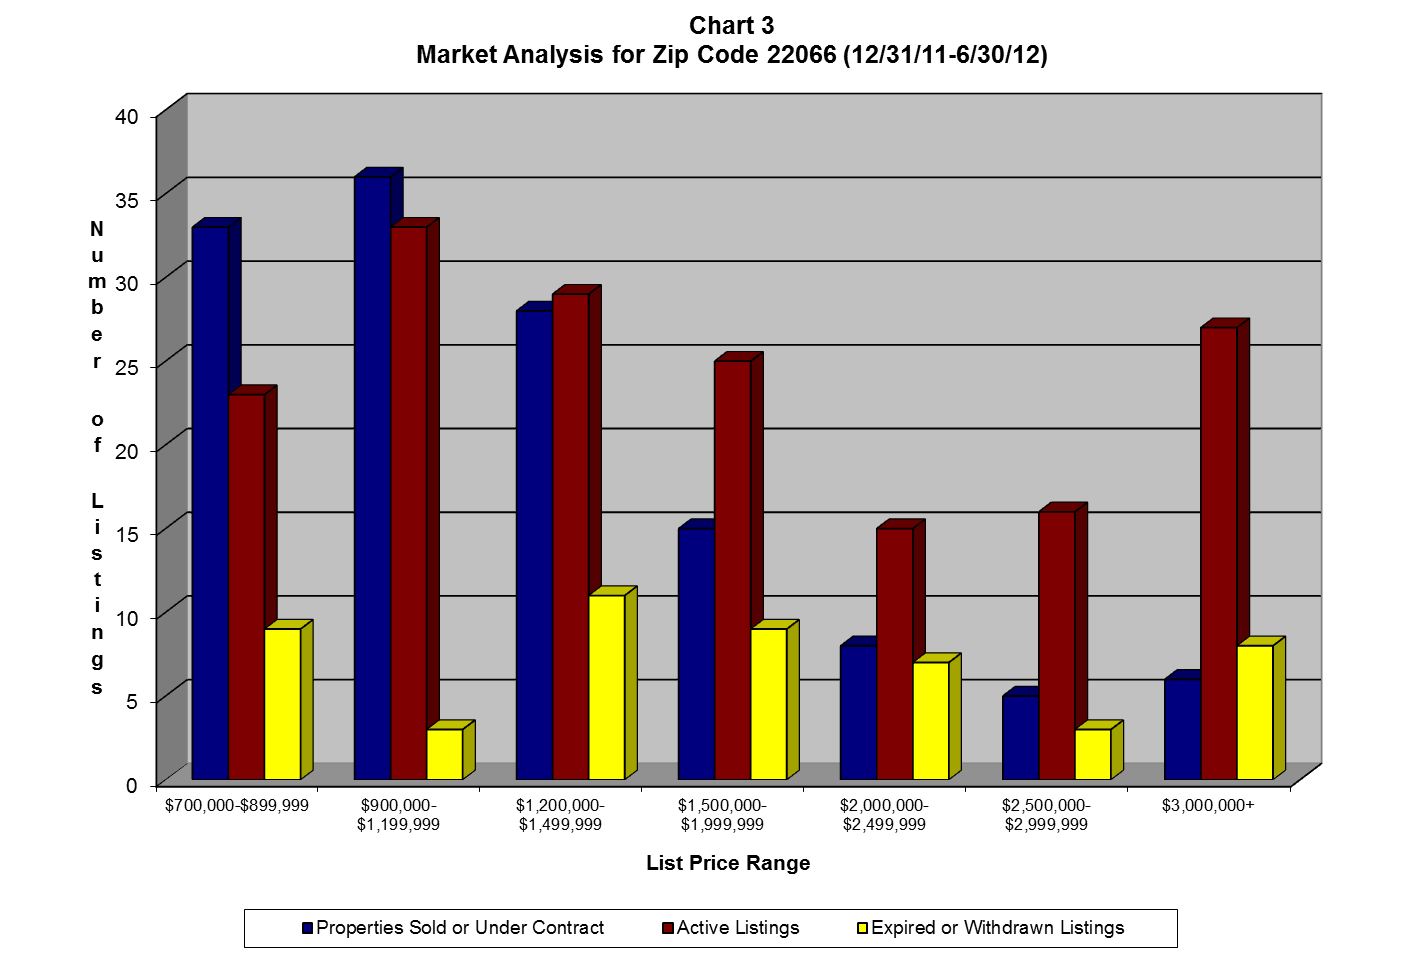
22066 $700,000-$899,999 Sellers’ 33 23 10 or 30.30% 9
22066 $900,000-$1,199,999 Sellers’ 36 33 3 or 8.33% 3
22066 $1,200,000-$1,499,999 Balanced 28 29 -1 or -3.57% 11
22066 $1,500,000-$1,999,999 Sellers’ 15 25 -10 or -66.67% 9
22066 $2,000,000-$2,499,999 Buyers’ 8 15 -7 or -87.50% 7
22066 $2,500,000-$2,999,999 Buyers’ 5 16 -11 or -220.00% 3
22066 $3,000,000+ Strong Buyers’ 6 27 -21 or -350.00% 8

Summary of Zip Code 22066

•             $700,000 – $899,999 – Sellers’ Market. The number of homes that sold between 9/30/11 and 6/30/12 plus the number of homes currently under contract is close to 1 ½ times more than the number of homes currently listed for sale. If you factor in the homes that have been withdrawn from the market or listings allowed to expire, the price range would shift from a sellers’ market to a balanced market.

•             $900,000 – 1,199,999 – Sellers’ Market. The number of homes that sold between 12/31/11 and 6/30/12 plus the number of homes currently under contract is slightly more than the number of homes currently listed for sale.  If you factor in the properties that have been withdrawn and listings allowed to expire, this price range would be balanced.

•             $1,200,000 – $1,499,999 – Balanced Market. The number of homes currently listed for sale is almost equal to the number of homes sold between 12/31/11 and 6/30/12 plus the number of properties currently under contract. If you factor in the homes that were withdrawn from the market and the homes that were allowed to expire, this price range would shift from a balanced market to a sellers’ market.

•             $1,500,000 – $1,999,999 – Buyers’ Market. The number of homes that sold between 12/31/11 and 6/30/12 plus the number of homes currently under contract is more than 1 ½ times the number of homes currently listed for sale. If you factor in the homes that were withdrawn from the market and the homes that were allowed to expire, there would be more than 2 times the number of homes for sale and sold plus under contract homes and this price range would be a stronger buyers’ market.

•             $2,000,000 – $2,499,999 – Buyers’ Market. The number of homes currently listed for sale is almost twice the number of properties sold between 12/31/11 and 6/30/12 plus the number of homes currently under contract. If you factor in the homes that were withdrawn from the market and the homes that were allowed to expire, the number of homes for sale would be more than 2 ½ times the number of sold plus under contract homes and this price range would be a stronger buyers’ market.

•             $2,500,000 – $2,999,999 – Buyers’ Market. The number homes currently listed for sale is more than 3 times the number of properties sold between 12/31/11 and 6/30/12 plus the number of homes currently under contract. If you factor in the homes that were withdrawn from the market and the homes that were allowed to expire, the number of homes for sale would be close to 4 times the number of sold plus under contract homes and this price range would be a stronger buyers’ market.

•             $3,000,000 and up – Strong Buyers’ Market. The number of homes currently on the market is more than 4 times the number of homes sold between 12/31/11 and 6/30/12 plus the number of homes currently under contract. If you factor in the homes that were withdrawn from the market and the homes that were allowed to expire, the number of homes for sale would be almost 6 times the number of sold plus under contract homes and this price range would be an even stronger buyers’ market.

Note: All of the numbers for the withdrawn and expired listings were cross referenced against currently active listings, sold listings and under contract listings.  If they were listed in another category, they were excluded from the numbers and thus not accounted for more than once.

31
Jul
12

McLean – Great Falls Market Analysis – Quarter End 6/30/12

McLean-Great Falls Market Analysis

(12/31/11-6/30/12)

 Tables 1, 2 and 3 and Charts 1, 2 and 3 compare the number of active listings (the supply) to the number of properties sold or under contract (the demand) in the local real estate markets of McLean and Great Falls (zip codes 22101, 22102 and 22066) by price range for the period from 12/31/11 – 6/30/12.  The following chart depicts the relationship between supply, demand and price.

Based on the current data, the real estate markets in our area can be characterized in one of three ways:

Buyers’ Market – More Active Listings (Supply) than Sold and Under Contract Listings (Demand)

Balanced Market – An Equal Number of Active Listings (Supply) as compared to Sold and Under Contract Listings (Demand)

Sellers’ Market – More Sold and Under Contract Listings (Demand) than Active Listings (Supply)

Table 1

Table 1
Market Analysis for Zip Code 22101 (12/31/11 – 6/30/12)
Solds + Expireds +
Contracts Withdrawns
Zip Type of (12/31/11 Active (12/31/11-
Code List Price Range Market -6/30/12)   Listings Difference 6/30/12)
22101 $700,000-$899,999 Sellers’ 74 17 57 or 77.03% 11
22101 $900,000-$1,199,999 Sellers’ 37 23 14 or 37.84% 10
22101 $1,200,000-$1,499,999 Sellers’ 39 18 21 or 53.85% 13
22101 $1,500,000-$1,999,999 Balanced 42 40 2 or 4.76% 13
22101 $2,000,000-$2,499,999 Buyers’ 10 15 -5 or -50.00% 10
22101 $2,500,000-$2,999,999 Balanced 5 5 0 or 0.00% 2
22101 $3,000,000+ Strong Buyers’ 7 17 -10 or -142.86% 6

Summary of Zip Code 22101

•             $700,000 – $899,999 – Sellers’ Market. The number of homes sold between 12/31/11 and 6/30/12 combined with the number of properties currently under contract is more than 4 times the number of homes currently on the market (active listings). If you factor in the property listings that expired or were withdrawn from the market, there are still more than twice the number of sold properties plus under contract properties than currently listed properties, and this price range is still a sellers’ market.

•             $900,000 – $1,199,999 – Sellers’ Market. The number of homes that sold between 12/31/11 and 6/30/12 plus the number of currently under contract properties is more than 1 ½ times the number of homes currently listed for sale. If you factor in the property listings that were withdrawn from the market or listings that expired, this price range becomes closer to a balanced market.

•             $1,200,000 – $1,499,999 – Sellers’ Market. The number of homes that sold between 12/31/11 and 6/30/12 plus the number of currently under contract properties is more than twice the number of homes currently listed for sale. If you factor in the properties that were withdrawn from the market or listings that expired, this price range is closer to a balanced market.

•             $1,500,000 – $1,999,999 – Balanced Market. The number of homes currently on the market is slightly more than the number of homes sold between 12/31/11 and 6/30/12 and under contract properties combined, so it is effectively a balanced market. If you factor in the property 13 listings that were withdrawn or expired, this price range would be a buyers’ market.

•             $2,000,000 – $2,499,999 – Buyers’ Market. The number of homes currently on the market is 1½ times the number of properties that sold between 12/31/11 and 6/30/12 combined with the number of homes currently under contract. If you factor in the property listings that were withdrawn or expired, the number of active listings would be 2 ½ times the number of sold plus under contract listings and this price range would be a stronger buyers’ market.

•             $2,500,000 – $2,999,999 – Balanced Market. The number of homes currently listed for sale is equal to the number of homes sold between 12/31/11 and 6/30/12 plus the number of properties currently under contract. If you factor in the properties that were withdrawn from the market or expired listings, this price range shifts from a balanced market to a buyers’ market.

•             $3,000,000 and up – Buyers’ Market. The number of homes currently on the market is more than 2 times the number of properties sold between 12/31/11 and 6/30/12 and the number of currently under contract listings combined. The number of withdrawn and expired listings, if they were put back on the market, would make the number of active listings more than 3 times the number of sold plus under contract listings and make this price range a stronger buyers’ market.

Table 2

Table 2
Market Analysis for Zip Code 22102 (12/31/11 – 6/30/12)
Solds + Expireds +
Contracts Withdrawns
Zip Type of (12/31/11 Active (12/31/11-
Code List Price Range Market -6/30/12) Listings Difference 6/30/12)
22102 $700,000-$899,999 Sellers’ 22 11 11  or 50.00% 1
22102 $900,000-$1,199,999 Sellers’ 27 12 15  or 55.56% 3
22102 $1,200,000-$1,499,999 Sellers’ 15 11 4  or 26.67% 4
22102 $1,500,000-$1,999,999 Balanced 14 13 1  or 7.14% 2
22102 $2,000,000-$2,499,999 Buyers’ 11 11 0  or 0.00% 1
22102 $2,500,000-$2,999,999 Strong Buyers’ 3 13 -10  or -333.33% 5
22102 $3,000,000+ Strong Buyers’ 7 31 -24  or -342.86% 3

Summary of Zip Code 22102

•             $700,000 – $899,999 – Sellers’ Market.  The number of properties sold between 12/31/11 and 6/30/12 combined with the number of under contract listings is twice the number of homes currently on the market (active listings).  If you factor in the 1 property listing that expired, there are still close to 2 times the number of sold properties plus under contract properties as the number of active listings and the price range is still a sellers’ market.

•             $900,000 – $1,199,999 – Sellers’ Market.  The number of properties sold between 12/31/11 and 6/30/12 combined with the number of under contract listings is more than twice the number of homes currently on the market.  If you factor in the properties that were withdrawn from the market and listings that expired, this price range stays a sellers’ market.

•             $1,200,000 – $1,499,999 – Sellers’ Market.  The number of properties sold between 12/31/11 and 6/30/12 plus the number of under contract listings is slightly more than the number of homes for sale.  If you factor in the properties that were withdrawn from the market and listings that expired, this price range shifts from a sellers’ market to a balanced market.

•             $1,500,000 – $1,999,999 – Balanced Market.  There is an almost equal number of homes for sale as number of homes sold between 12/31/11 and 6/30/12 plus under contract homes.  If you factor in the number of properties that were withdrawn from the market and listings allowed to expire, this price range stays a balanced market.

•             $2,000,000 – $2,499,999 – Balanced Market.  The number of properties for sales is equal to the number of homes sold between 12/31/11 and 6/30/12 plus the number of homes currently under contract.  If you factor in the properties that were withdrawn from the market and listings that expired, this price range stays a balanced market.

•             $2,500,000 – $2,999,999 – Strong Buyers’ Market.  The number of homes listed for sale is more than 4 times the number of homes sold between 12/31/11 and 6/30/12 combined with the number of properties currently under contract.  If you factor in the properties that were withdrawn from the market and listings that expired, there would be 6 times the number of homes on the market as sold homes combined with the number of properties currently under contract and it would be an even stronger buyers’ market.

•             $3,000,000 and up – Strong Buyers’ Market.  The number of homes currently listed for sale is more than 4 times the number of homes sold between 12/31/11 and 6/30/12 plus the number of homes currently under contract.

Table 3

Table 3
Market Analysis for Zip Code 22066 (12/31/11 – 6/30/12)
Solds + Expireds +
Contracts Withdrawns
Zip Type of (12/31/11 Active (12/31/11-
Code List Price Range Market -6/30/12) Listings Difference 6/30/12)
22066 $700,000-$899,999 Sellers’ 33 23 10 or 30.30% 9
22066 $900,000-$1,199,999 Sellers’ 36 33 3 or 8.33% 3
22066 $1,200,000-$1,499,999 Balanced 28 29 -1 or -3.57% 11
22066 $1,500,000-$1,999,999 Sellers’ 15 25 -10 or -66.67% 9
22066 $2,000,000-$2,499,999 Buyers’ 8 15 -7 or -87.50% 7
22066 $2,500,000-$2,999,999 Buyers’ 5 16 -11 or -220.00% 3
22066 $3,000,000+ Strong Buyers’ 6 27 -21 or -350.00% 8

Summary of Zip Code 22066

•             $700,000 – $899,999 – Sellers’ Market. The number of homes that sold between 9/30/11 and 6/30/12 plus the number of homes currently under contract is close to 1 ½ times more than the number of homes currently listed for sale. If you factor in the homes that have been withdrawn from the market or listings allowed to expire, the price range would shift from a sellers’ market to a balanced market.

•             $900,000 – 1,199,999 – Sellers’ Market. The number of homes that sold between 12/31/11 and 6/30/12 plus the number of homes currently under contract is slightly more than the number of homes currently listed for sale.  If you factor in the properties that have been withdrawn and listings allowed to expire, this price range would be balanced.

•             $1,200,000 – $1,499,999 – Balanced Market. The number of homes currently listed for sale is almost equal to the number of homes sold between 12/31/11 and 6/30/12 plus the number of properties currently under contract. If you factor in the homes that were withdrawn from the market and the homes that were allowed to expire, this price range would shift from a balanced market to a sellers’ market.

•             $1,500,000 – $1,999,999 – Buyers’ Market. The number of homes that sold between 12/31/11 and 6/30/12 plus the number of homes currently under contract is more than 1 ½ times the number of homes currently listed for sale. If you factor in the homes that were withdrawn from the market and the homes that were allowed to expire, there would be more than 2 times the number of homes for sale and sold plus under contract homes and this price range would be a stronger buyers’ market.

•             $2,000,000 – $2,499,999 – Buyers’ Market. The number of homes currently listed for sale is almost twice the number of properties sold between 12/31/11 and 6/30/12 plus the number of homes currently under contract. If you factor in the homes that were withdrawn from the market and the homes that were allowed to expire, the number of homes for sale would be more than 2 ½ times the number of sold plus under contract homes and this price range would be a stronger buyers’ market.

•             $2,500,000 – $2,999,999 – Buyers’ Market. The number homes currently listed for sale is more than 3 times the number of properties sold between 12/31/11 and 6/30/12 plus the number of homes currently under contract. If you factor in the homes that were withdrawn from the market and the homes that were allowed to expire, the number of homes for sale would be close to 4 times the number of sold plus under contract homes and this price range would be a stronger buyers’ market.

•             $3,000,000 and up – Strong Buyers’ Market. The number of homes currently on the market is more than 4 times the number of homes sold between 12/31/11 and 6/30/12 plus the number of homes currently under contract. If you factor in the homes that were withdrawn from the market and the homes that were allowed to expire, the number of homes for sale would be almost 6 times the number of sold plus under contract homes and this price range would be an even stronger buyers’ market.

Note: All of the numbers for the withdrawn and expired listings were cross referenced against currently active listings, sold listings and under contract listings.  If they were listed in another category, they were excluded from the numbers and thus not accounted for more than once.



“it’s not your father’s real estate market anymore” ®

Tania Hosmer

Unknown's avatar

Tania grew up in Northern Virginia and is a life long resident of the area. She has lived in McLean, Virginia with her husband and 2 children since 2001. She holds a bachelor’s degree in Physics from Mary Washington College and an MBA in Finance from The George Washington University. Tania began her real estate career over 20 years ago. In addition to real estate sales, her experience includes managing residential renovation projects in the greater Washington area, planning and overseeing new residential construction and managing rental properties. After completing her MBA in 1996, she joined CIG International (a Washington-based residential real estate investment firm) as Vice President where she conducted extensive due diligence investigations of real estate investment opportunities and oversaw ongoing investment projects. Tania became a residential real estate agent in 2006.

Contact Information:

Tania Hosmer
Keller Williams Realty
6820 Elm Street, Suite 100
McLean, Virginia 22101
cell: 703-403-8225
email: taniahosmer@gmail.com
website: www.taniahosmer.com

Enter your email address to subscribe to this blog and receive notifications of new posts by email.

Join 277 other subscribers

Disclaimer:

If your home is currently listed with another broker, this is not intended as a solicitation of that listing.